|
The Division of Water Resources (DWR) provides the data contained within this
Local Water Supply Plan (LWSP) as a courtesy and service to our customers.
DWR staff does not field verify data. Neither DWR, nor any other party
involved in the preparation of this LWSP attests that the data is completely
free of errors and omissions. Furthermore, data users are cautioned that
LWSPs labeled PROVISIONAL have yet to be reviewed by DWR staff. Subsequent
review may result in significant revision. Questions regarding the accuracy
or limitations of usage of this data should be directed to the water system
and/or DWR.
1. System Information
Contact Information
Complete
| Water System Name: |
Red Springs |
|
PWSID: |
03-78-015 |
| Mailing Address: | PO BOX 790
Red Springs, NC 28377 | Ownership: | Municipality |
| |
| Contact Person: | Timothy Mauldin | Title: | Public Works Director |
| Phone: | 910-843-5241 | Cell/Mobile: | 910-785-2093 |
| |
| Secondary Contact: | John Malone (NCRWA) | | Phone: | -- |
| Mailing Address: |
, NC | Cell/Mobile: | 910-785-2093 |
Distribution System
| Line Type |
Size Range (Inches) |
Estimated % of lines |
| Asbestos Cement |
6-12 |
1.00 % |
| Ductile Iron |
6-8 |
20.00 % |
| Polyvinyl Chloride |
6-12 |
79.00 % |
Programs
The Town owns a leak detection device. Water Conservation
There is an interconnection with Robeson County that is emergency use only. 2. Water Use Information
Service Area
| Sub-Basin(s) | % of Service Population |
|---|
| Lumber River (09-1) | 100 % |
|
| County(s) | % of Service Population |
|---|
| Robeson | 100 % |
|
Population is calculated from NCDEQ Drinking Water Watch website listed connections of 1769 x 2.54 people/connection.= 4,493 Population.
Water Use by Type
| Type of Use |
Metered
Connections |
Metered
Average Use (MGD) |
Non-Metered
Connections |
Non-Metered
Estimated Use (MGD) |
| Residential |
1,286 |
0.1841 |
0 |
0.0000 |
| Commercial |
221 |
0.0582 |
0 |
0.0000 |
| Industrial |
4 |
0.0006 |
1 |
0.1000 |
| Institutional |
0 |
0.0000 |
0 |
0.0000 |
How much water was used for system processes (backwash, line cleaning, flushing, etc.)? 0.0251 MGD
Unmetered Industrial Connection is the WWTP, flow is estimated. It was captured last year under process water.
The Town is replacing their existing meters over time with AMI meters.
Industrial total use is estimated based on the median of previous years consumption for three of the connections; only one meter is reading correctly. These are large buildings with low occupancy and limited water use.
Several large known leaks were repaired throughout 2024 reducing last years unaccounted for water from 60% down to 47%. This is expected to continue to go down as leaks are repaired. Metering of some accounts are also still suspect since upgrading the billing software. Water Sales
| Purchaser |
PWSID |
Average
Daily Sold
(MGD) |
Days
Used |
Contract |
Required to
comply with water
use restrictions? |
Pipe Size(s)
(Inches) |
Use
Type |
| MGD |
Expiration |
Recurring |
| Robeson Co |
03-78-055 |
0.0000 |
0 |
0.5500 |
|
No |
Yes |
6-12 |
Emergency |
No Water Sold to Robeson County in 2024. The connection is emergency use only. 3. Water Supply Sources
Monthly Withdrawals & Purchases
|
Average Daily
Use (MGD) |
Max Day
Use (MGD) |
|
Average Daily
Use (MGD) |
Max Day
Use (MGD) |
|
Average Daily
Use (MGD) |
Max Day
Use (MGD) |
| Jan |
0.6768 |
0.8744 |
May |
0.7082 |
0.9658 |
Sep |
0.7510 |
0.9777 |
| Feb |
0.6597 |
0.7698 |
Jun |
0.7508 |
0.9854 |
Oct |
0.6525 |
0.8297 |
| Mar |
0.7289 |
0.7962 |
Jul |
0.7544 |
0.9770 |
Nov |
0.6397 |
0.6763 |
| Apr |
0.7268 |
1.0138 |
Aug |
0.7204 |
0.8570 |
Dec |
0.6147 |
0.8351 |

Ground Water Sources
| Name or Number |
Average Daily Withdrawal (MGD) |
Max Day Withdrawal (MGD) |
12-Hour Supply
(MGD) |
CUA Reduction |
Year Offline |
Use Type |
| MGD |
Days Used |
| Well # 1-A |
0.4504 |
366 |
0.64386 |
0.4500 |
|
|
Regular |
| Well # 2 |
0.2482 |
366 |
0.369905 |
0.3600 |
|
|
Regular |
| Well # 3-A |
0.0080 |
4 |
0.01762 |
0.3800 |
|
|
Regular |
Ground Water Sources (continued)
| Name or Number |
Well Depth (Feet) |
Casing Depth
(Feet) |
Screen Depth (Feet) |
Well Diameter (Inches) |
Pump Intake Depth (Feet) |
Metered? |
| Top |
Bottom |
| Well # 1-A |
175 |
155 |
67 |
145 |
10 |
0 |
Yes |
| Well # 2 |
200 |
175 |
60 |
193 |
10 |
0 |
Yes |
| Well # 3-A |
160 |
156 |
85 |
148 |
10 |
0 |
Yes |
Approved Well Head Protection Plan # 7.1 June 2018. Well # 3 is not used often it's water quality causes issues with the membranes at the WTP. Water Purchases From Other Systems
| Seller |
PWSID |
Average
Daily Purchased
(MGD) |
Days
Used |
Contract |
Required to
comply with water
use restrictions? |
Pipe Size(s)
(Inches) |
Use
Type |
| MGD |
Expiration |
Recurring |
| Robeson Co |
03-78-055 |
0.0000 |
0 |
0.0000 |
2018 |
No |
Yes |
8 |
Emergency |
No Water Purchase from Robeson County in 2024. Water Treatment Plants
| Plant Name |
Permitted Capacity
(MGD) |
Is Raw Water Metered? |
Is Finished Water Ouput Metered? |
Source |
| E.H. Alexander Treatment Plant |
1.5000 |
Yes |
Yes |
Groundwater |
4. Wastewater Information
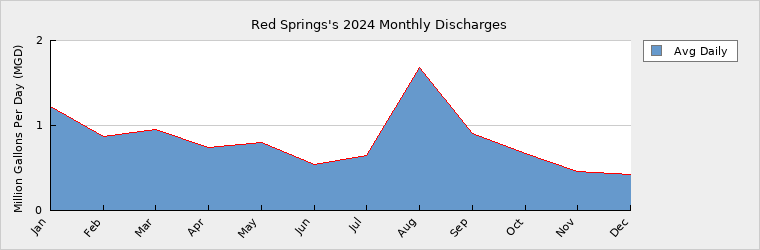
Monthly Discharges
|
Average Daily
Discharge (MGD) |
|
Average Daily
Discharge (MGD) |
|
Average Daily
Discharge (MGD) |
| Jan |
1.2207 |
May |
0.7942 |
Sep |
0.9062 |
| Feb |
0.8745 |
Jun |
0.5453 |
Oct |
0.6722 |
| Mar |
0.9505 |
Jul |
0.6450 |
Nov |
0.4546 |
| Apr |
0.7430 |
Aug |
1.6819 |
Dec |
0.4232 |
Wastewater Permits
| Permit Number |
Type |
Permitted Capacity
(MGD) |
Design Capacity
(MGD) |
Average Annual
Daily Discharge
(MGD) |
Maximum Day Discharge
(MGD) |
Receiving Stream |
Receiving Basin |
| NC0025577 |
WWTP |
2.5000 |
2.5000 |
0.8259 |
3.0110 |
Little Raft Swamp |
Lumber River (09-1) |
5. Planning
Projections
| |
2024 |
2030 |
2040 |
2050 |
2060 |
2070 |
| Year-Round Population |
4,493 |
4,275 |
3,909 |
3,574 |
3,268 |
2,988 |
| Seasonal Population |
0 |
0 |
0 |
0 |
0 |
0 |
| |
| Residential |
0.1841 |
0.1751 |
0.1601 |
0.1463 |
0.1337 |
0.1222 |
| Commercial |
0.0582 |
0.0554 |
0.0506 |
0.0463 |
0.0423 |
0.0386 |
| Industrial |
0.1006 |
0.1006 |
0.1006 |
0.1006 |
0.1006 |
0.1006 |
| Institutional |
0.0000 |
0.0000 |
0.0000 |
0.0000 |
0.0000 |
0.0000 |
| System Process |
0.0251 |
0.0204 |
0.0208 |
0.0212 |
0.0220 |
0.0300 |
| Unaccounted-for |
0.3307 |
0.3159 |
0.2984 |
0.2825 |
0.2683 |
0.2619 |
Projections based on a negative 0.99% annual growth rate per 2010-2020 census data. Demand v/s Percent of Supply
| |
2024 |
2030 |
2040 |
2050 |
2060 |
2070 |
| Surface Water Supply |
0.0000 |
0.0000 |
0.0000 |
0.0000 |
0.0000 |
0.0000 |
| Ground Water Supply |
1.1900 |
1.1900 |
1.1900 |
1.1900 |
1.1900 |
1.1900 |
| Purchases |
0.0000 |
0.0000 |
0.0000 |
0.0000 |
0.0000 |
0.0000 |
| Future Supplies |
0.0000 |
0.0000 |
0.0000 |
0.0000 |
0.0000 |
| Total Available Supply (MGD) |
1.1900 |
1.1900 |
1.1900 |
1.1900 |
1.1900 |
1.1900 |
| Service Area Demand |
0.6987 |
0.6674 |
0.6305 |
0.5969 |
0.5669 |
0.5533 |
| Sales |
0.0000 |
0.0000 |
0.0000 |
0.0000 |
0.0000 |
0.0000 |
| Future Sales |
0.0000 |
0.0000 |
0.0000 |
0.0000 |
0.0000 |
| Total Demand (MGD) |
0.6987 |
0.6674 |
0.6305 |
0.5969 |
0.5669 |
0.5533 |
| Demand as Percent of Supply |
59% |
56% |
53% |
50% |
48% |
46% |

The purpose of the above chart is to show a general indication of how the long-term per capita water demand changes over time. The per capita water demand may actually be different than indicated due to seasonal populations and the accuracy of data submitted. Water systems that have calculated long-term per capita water demand based on a methodology that produces different results may submit their information in the notes field.
Your long-term water demand is 41 gallons per capita per day. What demand management practices do you plan to implement to reduce the per capita water demand (i.e. conduct regular water audits, implement a plumbing retrofit program, employ practices such as rainwater harvesting or reclaimed water)? If these practices are covered elsewhere in your plan, indicate where the practices are discussed here.
None
Are there other demand management practices you will implement to reduce your future supply needs? None
What supplies other than the ones listed in future supplies are being considered to meet your future supply needs? None
How does the water system intend to implement the demand management and supply planning components above? N/A
Additional Information
Has this system participated in regional water supply or water use planning? No
What major water supply reports or studies were used for planning?
Please describe any other needs or issues regarding your water supply sources, any water system deficiencies or needed improvements (storage, treatment, etc.) or your ability to meet present and future water needs. Include both quantity and quality considerations, as well as financial, technical, managerial, permitting, and compliance issues: None
The Division of Water Resources (DWR) provides the data contained within this
Local Water Supply Plan (LWSP) as a courtesy and service to our customers.
DWR staff does not field verify data. Neither DWR, nor any other party
involved in the preparation of this LWSP attests that the data is completely
free of errors and omissions. Furthermore, data users are cautioned that
LWSPs labeled PROVISIONAL have yet to be reviewed by DWR staff. Subsequent
review may result in significant revision. Questions regarding the accuracy
or limitations of usage of this data should be directed to the water system
and/or DWR.
|