|
The Division of Water Resources (DWR) provides the data contained within this
Local Water Supply Plan (LWSP) as a courtesy and service to our customers.
DWR staff does not field verify data. Neither DWR, nor any other party
involved in the preparation of this LWSP attests that the data is completely
free of errors and omissions. Furthermore, data users are cautioned that
LWSPs labeled PROVISIONAL have yet to be reviewed by DWR staff. Subsequent
review may result in significant revision. Questions regarding the accuracy
or limitations of usage of this data should be directed to the water system
and/or DWR.
1. System Information
Contact Information
Complete
| Water System Name: |
Robeson Co |
|
PWSID: |
03-78-055 |
| Mailing Address: | 176 Legend Road
Lumberton, NC 28358 | Ownership: | County |
| |
| Contact Person: | Myron Neville | Title: | Public Utilites Director |
| Phone: | 910-671-3485 | Cell/Mobile: | -- |
Distribution System
| Line Type |
Size Range (Inches) |
Estimated % of lines |
| Asbestos Cement |
6-12 |
1.00 % |
| Ductile Iron |
4-30 |
1.00 % |
| Polyvinyl Chloride |
2-12 |
98.00 % |
Programs
Water Conservation
2. Water Use Information
Service Area
| Sub-Basin(s) | % of Service Population |
|---|
| Lumber River (09-1) | 90 % |
| Big Shoe Heel Creek (09-2) | 10 % |
|
| County(s) | % of Service Population |
|---|
| Robeson | 100 % |
|
Water Use by Type
| Type of Use |
Metered
Connections |
Metered
Average Use (MGD) |
Non-Metered
Connections |
Non-Metered
Estimated Use (MGD) |
| Residential |
27,022 |
4.2270 |
0 |
0.0000 |
| Commercial |
166 |
6.1250 |
0 |
0.0000 |
| Industrial |
0 |
0.0000 |
0 |
0.0000 |
| Institutional |
0 |
0.0000 |
0 |
0.0000 |
How much water was used for system processes (backwash, line cleaning, flushing, etc.)? 2.2000 MGD
Water Sales
| Purchaser |
PWSID |
Average
Daily Sold
(MGD) |
Days
Used |
Contract |
Required to
comply with water
use restrictions? |
Pipe Size(s)
(Inches) |
Use
Type |
| MGD |
Expiration |
Recurring |
| Boardman |
04-24-075 |
0.0000 |
0 |
0.0500 |
|
Yes |
Yes |
8 |
Emergency |
| Hoke RWS |
03-47-025 |
0.0000 |
0 |
0.0000 |
|
No |
Yes |
6 |
Emergency |
| Lumberton |
03-78-010 |
0.0000 |
0 |
0.0000 |
|
Yes |
Yes |
8 |
Emergency |
| Maxton |
03-78-035 |
0.0330 |
7 |
0.0000 |
2018 |
No |
Yes |
8 |
Emergency |
| Parkton |
03-78-045 |
0.0400 |
4 |
0.0000 |
|
No |
Yes |
6 |
Emergency |
| Pembroke Purchase system |
50-78-007 |
0.0190 |
366 |
0.0000 |
|
No |
Yes |
6 |
Regular |
| Red Springs |
03-78-015 |
0.0000 |
0 |
0.0000 |
2018 |
No |
Yes |
8 |
Emergency |
| Rowland |
03-78-040 |
0.0000 |
0 |
0.0000 |
2018 |
No |
Yes |
6,8 |
Emergency |
| St. Pauls |
03-78-030 |
0.0200 |
366 |
0.0000 |
2018 |
Yes |
Yes |
6-8 |
Regular |
3. Water Supply Sources
Monthly Withdrawals & Purchases
|
Average Daily
Use (MGD) |
Max Day
Use (MGD) |
|
Average Daily
Use (MGD) |
Max Day
Use (MGD) |
|
Average Daily
Use (MGD) |
Max Day
Use (MGD) |
| Jan |
14.3470 |
16.7740 |
May |
14.4390 |
16.7910 |
Sep |
15.1890 |
17.4510 |
| Feb |
13.8330 |
16.5010 |
Jun |
15.7880 |
17.9320 |
Oct |
15.6030 |
17.2400 |
| Mar |
13.7180 |
16.0270 |
Jul |
14.5280 |
16.4860 |
Nov |
14.8080 |
16.9390 |
| Apr |
13.8040 |
16.9680 |
Aug |
15.3740 |
17.6880 |
Dec |
14.3210 |
16.8030 |

Ground Water Sources
| Name or Number |
Average Daily Withdrawal (MGD) |
Max Day Withdrawal (MGD) |
12-Hour Supply
(MGD) |
CUA Reduction |
Year Offline |
Use Type |
| MGD |
Days Used |
| 10 |
0.9090 |
361 |
|
0.8640 |
|
|
Regular |
| 11 |
0.7150 |
365 |
|
0.6480 |
|
|
Regular |
| 12 |
0.3390 |
44 |
|
0.6480 |
|
|
Regular |
| 14 |
0.4040 |
353 |
|
0.5040 |
|
|
Regular |
| 16 |
0.0000 |
0 |
|
0.2880 |
|
|
Regular |
| 17 |
0.1850 |
336 |
|
0.2160 |
|
|
Regular |
| 18 |
0.1230 |
336 |
|
0.1440 |
|
|
Regular |
| 19 |
0.2150 |
336 |
|
0.2520 |
|
|
Regular |
| 2 |
0.3420 |
366 |
|
0.5040 |
|
|
Regular |
| 21 |
0.2150 |
336 |
|
0.2520 |
|
|
Regular |
| 22 |
0.3910 |
366 |
|
0.5760 |
|
|
Regular |
| 23 |
0.3910 |
366 |
|
0.5760 |
|
|
Regular |
| 25 |
0.3260 |
366 |
|
0.5040 |
|
|
Regular |
| 26 |
0.3260 |
366 |
|
0.5040 |
|
|
Regular |
| 27B |
0.3260 |
366 |
|
0.5040 |
|
|
Regular |
| 28 |
0.2100 |
366 |
|
0.3240 |
|
|
Regular |
| 29A |
0.4270 |
362 |
|
0.3240 |
|
|
Regular |
| 3 |
0.2690 |
366 |
|
0.3960 |
|
|
Regular |
| 30 |
0.2740 |
366 |
|
0.4320 |
|
|
Regular |
| 31 |
0.4400 |
366 |
|
0.6480 |
|
|
Regular |
| 32 |
0.3170 |
366 |
|
0.4680 |
|
|
Regular |
| 33 |
0.5180 |
296 |
|
0.7300 |
|
|
Regular |
| 34 |
0.3260 |
366 |
|
0.5040 |
|
|
Regular |
| 35 |
0.2110 |
366 |
|
0.3260 |
|
|
Regular |
| 40 |
0.2930 |
366 |
|
0.4320 |
|
|
Regular |
| 41 |
0.6520 |
366 |
|
1.0080 |
|
|
Regular |
| 42 |
0.4660 |
366 |
|
0.7200 |
|
|
Regular |
| 44 |
0.3730 |
366 |
|
0.5760 |
|
|
Regular |
| 46 |
0.2930 |
366 |
|
0.4320 |
|
|
Regular |
| 48 |
0.2810 |
366 |
|
0.4140 |
|
|
Regular |
| 49 |
0.2810 |
366 |
|
0.4140 |
|
|
Regular |
| 4A |
0.3660 |
366 |
|
0.5400 |
|
|
Regular |
| 50 |
0.2440 |
366 |
|
0.3600 |
|
|
Regular |
| 51 |
0.1830 |
366 |
|
0.2700 |
|
|
Regular |
| 52 |
0.5370 |
188 |
|
0.2880 |
|
|
Regular |
| 53 |
0.3260 |
366 |
|
0.5040 |
|
|
Regular |
| 54 |
0.3260 |
366 |
|
0.5040 |
|
|
Regular |
| 55 |
0.2930 |
366 |
|
0.4320 |
|
|
Regular |
| 57 |
0.1750 |
366 |
|
0.2700 |
|
|
Regular |
| 58 |
0.2100 |
366 |
|
0.3240 |
|
|
Regular |
| 5A |
0.6820 |
366 |
|
1.0080 |
|
|
Regular |
| 6 |
0.3910 |
366 |
|
0.5760 |
|
|
Regular |
| 7 |
0.5110 |
350 |
|
0.2520 |
|
|
Regular |
| 9 |
0.3420 |
366 |
|
0.5040 |
|
|
Regular |
Ground Water Sources (continued)
| Name or Number |
Well Depth (Feet) |
Casing Depth
(Feet) |
Screen Depth (Feet) |
Well Diameter (Inches) |
Pump Intake Depth (Feet) |
Metered? |
| Top |
Bottom |
| 10 |
195 |
82 |
82 |
185 |
16 |
0 |
Yes |
| 11 |
180 |
90 |
90 |
175 |
12 |
0 |
Yes |
| 12 |
241 |
170 |
170 |
229 |
12 |
130 |
Yes |
| 14 |
225 |
107 |
107 |
215 |
12 |
0 |
Yes |
| 16 |
170 |
90 |
90 |
160 |
12 |
133 |
Yes |
| 17 |
144 |
65 |
65 |
134 |
10 |
115 |
Yes |
| 18 |
106 |
50 |
50 |
94 |
10 |
80 |
Yes |
| 19 |
112 |
53 |
53 |
100 |
10 |
80 |
Yes |
| 2 |
0 |
0 |
0 |
0 |
12 |
0 |
Yes |
| 21 |
113 |
46 |
46 |
101 |
10 |
0 |
Yes |
| 22 |
160 |
105 |
105 |
155 |
12 |
0 |
Yes |
| 23 |
173 |
100 |
100 |
170 |
12 |
125 |
Yes |
| 25 |
131 |
85 |
85 |
125 |
10 |
0 |
Yes |
| 26 |
135 |
0 |
0 |
0 |
10 |
0 |
Yes |
| 27B |
103 |
66 |
66 |
103 |
10 |
0 |
Yes |
| 28 |
88 |
37 |
37 |
75 |
10 |
0 |
Yes |
| 29A |
130 |
84 |
84 |
124 |
8 |
|
Yes |
| 3 |
0 |
0 |
0 |
0 |
12 |
0 |
No |
| 30 |
197 |
130 |
130 |
190 |
12 |
117 |
Yes |
| 31 |
170 |
70 |
70 |
162 |
16 |
131 |
Yes |
| 32 |
186 |
72 |
72 |
177 |
12 |
117 |
Yes |
| 33 |
264 |
195 |
195 |
252 |
12 |
143 |
Yes |
| 34 |
152 |
68 |
68 |
145 |
12 |
70 |
Yes |
| 35 |
130 |
83 |
83 |
123 |
10 |
80 |
Yes |
| 40 |
162 |
79 |
79 |
159 |
12 |
|
Yes |
| 41 |
143 |
80 |
80 |
135 |
10 |
80 |
Yes |
| 42 |
165 |
66 |
66 |
157 |
10 |
80 |
Yes |
| 44 |
168 |
55 |
55 |
160 |
10 |
80 |
Yes |
| 46 |
178 |
90 |
90 |
170 |
12 |
0 |
Yes |
| 48 |
180 |
90 |
90 |
172 |
12 |
0 |
Yes |
| 49 |
193 |
89 |
89 |
185 |
12 |
0 |
Yes |
| 4A |
180 |
82 |
82 |
172 |
12 |
0 |
Yes |
| 50 |
180 |
98 |
98 |
172 |
12 |
0 |
Yes |
| 51 |
178 |
110 |
110 |
170 |
12 |
0 |
Yes |
| 52 |
200 |
120 |
120 |
192 |
10 |
|
Yes |
| 53 |
149 |
82 |
82 |
144 |
12 |
|
Yes |
| 54 |
148 |
72 |
72 |
146 |
12 |
|
Yes |
| 55 |
186 |
97 |
97 |
178 |
12 |
0 |
Yes |
| 57 |
120 |
69 |
69 |
115 |
10 |
|
Yes |
| 58 |
120 |
62 |
62 |
116 |
10 |
|
Yes |
| 5A |
171 |
81 |
81 |
165 |
16 |
0 |
Yes |
| 6 |
173 |
71 |
71 |
161 |
12 |
100 |
Yes |
| 7 |
220 |
100 |
100 |
215 |
12 |
0 |
Yes |
| 9 |
195 |
72 |
72 |
182 |
12 |
0 |
Yes |
Well 27 was redrilled. It is now well 27B
Well 5 was redrilled. It is now well 5A Water Purchases From Other Systems
| Seller |
PWSID |
Average
Daily Purchased
(MGD) |
Days
Used |
Contract |
Required to
comply with water
use restrictions? |
Pipe Size(s)
(Inches) |
Use
Type |
| MGD |
Expiration |
Recurring |
| Lumberton |
03-78-010 |
0.0000 |
0 |
0.5000 |
2029 |
Yes |
Yes |
6-12 |
Emergency |
| Maxton |
03-78-035 |
0.0000 |
0 |
0.0000 |
|
No |
Yes |
6-8 |
Emergency |
| Parkton |
03-78-045 |
0.0000 |
0 |
0.0000 |
|
No |
Yes |
6 |
Emergency |
| Red Springs |
03-78-015 |
0.0000 |
0 |
0.5500 |
|
No |
Yes |
6-12 |
Emergency |
| Rowland |
03-78-040 |
0.0000 |
0 |
0.0000 |
|
No |
Yes |
6,8 |
Emergency |
Water Treatment Plants
| Plant Name |
Permitted Capacity
(MGD) |
Is Raw Water Metered? |
Is Finished Water Ouput Metered? |
Source |
| Gaddysville WTP |
1.2960 |
Yes |
Yes |
Well 12 |
| I-95 WTP |
2.0000 |
Yes |
Yes |
Well 10 |
| Lamb Road WTF |
0.2880 |
Yes |
Yes |
Well 52 |
| Lumber Bridge WTP |
9.0000 |
Yes |
Yes |
Wells 25,26,27B,28,34,35,41,42,44,53,54,57,58 |
| Maxton WTP |
12.0000 |
Yes |
Yes |
Well2,3,4A,5A,6,9,22,23,31,32,40,46,48,49,50,51,55 |
| NC 20 (Rex) WTP |
0.7200 |
Yes |
Yes |
Well 29A |
| Parkton WTP |
0.4320 |
Yes |
Yes |
Well 20 (abandoned) |
| Pope Road WTP |
0.2700 |
Yes |
Yes |
Well 8 (abandoned) |
| Raemon WTP (Midway) |
0.7300 |
Yes |
Yes |
Well 33 |
| Raynham WTP |
0.4520 |
Yes |
Yes |
Well 7 |
| Regan Road WTP |
0.8280 |
Yes |
Yes |
Well 14 |
| Rocco WTP |
2.0000 |
Yes |
Yes |
Wells 17, 18, 19, and 21 |
| Saddletree WTP |
2.0000 |
Yes |
Yes |
Well 11 |
| Sanchez Drive WTP |
0.7200 |
Yes |
Yes |
Well 30 |
| St. Pauls East WTP |
0.4320 |
Yes |
Yes |
Well 16 |
4. Wastewater Information
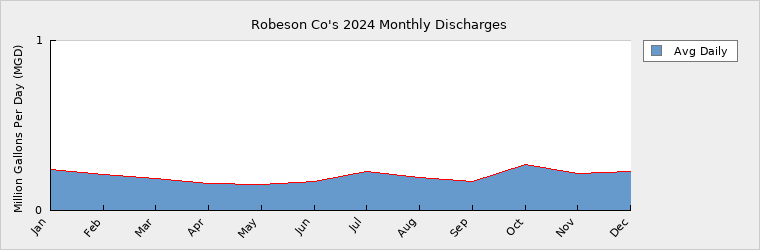
Monthly Discharges
|
Average Daily
Discharge (MGD) |
|
Average Daily
Discharge (MGD) |
|
Average Daily
Discharge (MGD) |
| Jan |
0.2440 |
May |
0.1530 |
Sep |
0.1720 |
| Feb |
0.2130 |
Jun |
0.1720 |
Oct |
0.2700 |
| Mar |
0.1870 |
Jul |
0.2320 |
Nov |
0.2160 |
| Apr |
0.1560 |
Aug |
0.1950 |
Dec |
0.2300 |
Wastewater Permits
| Permit Number |
Type |
Permitted Capacity
(MGD) |
Design Capacity
(MGD) |
Average Annual
Daily Discharge
(MGD) |
Maximum Day Discharge
(MGD) |
Receiving Stream |
Receiving Basin |
| NC0048577 |
WTP |
0.2000 |
0.2000 |
0.1160 |
0.1910 |
Lumber River |
Lumber River (09-1) |
| NC0084204 |
WTP |
0.2000 |
0.2000 |
0.0190 |
0.0240 |
Lumber River |
Lumber River (09-1) |
| NC0085685 |
WTP |
0.2000 |
0.2000 |
0.0570 |
0.1090 |
Big Marsh Swamp |
Lumber River (09-1) |
| NC0086894 |
WTP |
0.1140 |
0.1140 |
0.0040 |
0.0120 |
Watering Hole Swamp |
Lumber River (09-1) |
| NC0086991 |
WTP |
0.1000 |
0.1000 |
0.0040 |
0.0130 |
Little Jacob Swamp |
Lumber River (09-1) |
5. Planning
Projections
| |
2024 |
2030 |
2040 |
2050 |
2060 |
2070 |
| Year-Round Population |
67,825 |
69,075 |
71,525 |
74,025 |
76,525 |
79,025 |
| Seasonal Population |
0 |
0 |
0 |
0 |
0 |
0 |
| |
| Residential |
4.2270 |
4.3050 |
4.4600 |
4.6210 |
4.7870 |
4.9590 |
| Commercial |
6.1250 |
6.7380 |
7.4110 |
8.1520 |
8.9680 |
9.8640 |
| Industrial |
0.0000 |
0.0000 |
0.0000 |
0.0000 |
0.0000 |
0.0000 |
| Institutional |
0.0000 |
0.0000 |
0.0000 |
0.0000 |
0.0000 |
0.0000 |
| System Process |
2.2000 |
2.2000 |
2.2000 |
2.2000 |
2.2500 |
2.2500 |
| Unaccounted-for |
2.0572 |
1.6000 |
1.7000 |
1.8000 |
1.9000 |
2.0000 |
Future Supply Sources
| Source Name |
PWSID |
Source Type |
Additional Supply |
Year Online |
Year Offline |
Type |
| 2 additional wells |
03-78-055 |
Ground |
2.5200 |
2060 |
|
Regular |
| 5 additional wells |
03-78-055 |
Ground |
2.5200 |
2050 |
|
Regular |
Demand v/s Percent of Supply
| |
2024 |
2030 |
2040 |
2050 |
2060 |
2070 |
| Surface Water Supply |
0.0000 |
0.0000 |
0.0000 |
0.0000 |
0.0000 |
0.0000 |
| Ground Water Supply |
20.9640 |
20.9640 |
20.9640 |
20.9640 |
20.9640 |
20.9640 |
| Purchases |
0.0000 |
0.0000 |
0.0000 |
0.0000 |
0.0000 |
0.0000 |
| Future Supplies |
0.0000 |
0.0000 |
2.5200 |
5.0400 |
5.0400 |
| Total Available Supply (MGD) |
20.9640 |
20.9640 |
20.9640 |
23.4840 |
26.0040 |
26.0040 |
| Service Area Demand |
14.6092 |
14.8430 |
15.7710 |
16.7730 |
17.9050 |
19.0730 |
| Sales |
0.0401 |
0.0390 |
0.0390 |
0.0390 |
0.0390 |
0.0390 |
| Future Sales |
0.0000 |
0.0000 |
0.0000 |
0.0000 |
0.0000 |
| Total Demand (MGD) |
14.6493 |
14.8820 |
15.8100 |
16.8120 |
17.9440 |
19.1120 |
| Demand as Percent of Supply |
70% |
71% |
75% |
72% |
69% |
73% |

The purpose of the above chart is to show a general indication of how the long-term per capita water demand changes over time. The per capita water demand may actually be different than indicated due to seasonal populations and the accuracy of data submitted. Water systems that have calculated long-term per capita water demand based on a methodology that produces different results may submit their information in the notes field.
Your long-term water demand is 62 gallons per capita per day. What demand management practices do you plan to implement to reduce the per capita water demand (i.e. conduct regular water audits, implement a plumbing retrofit program, employ practices such as rainwater harvesting or reclaimed water)? If these practices are covered elsewhere in your plan, indicate where the practices are discussed here.
No changes
Are there other demand management practices you will implement to reduce your future supply needs? None available at this time
What supplies other than the ones listed in future supplies are being considered to meet your future supply needs? Drill wells as needed
How does the water system intend to implement the demand management and supply planning components above? Upgrade system as needed
Additional Information
Has this system participated in regional water supply or water use planning? Yes, Please contact Myron Neville, Public Utilities Director for further information
What major water supply reports or studies were used for planning? 2023 LWSP,
Please describe any other needs or issues regarding your water supply sources, any water system deficiencies or needed improvements (storage, treatment, etc.) or your ability to meet present and future water needs. Include both quantity and quality considerations, as well as financial, technical, managerial, permitting, and compliance issues:
The Division of Water Resources (DWR) provides the data contained within this
Local Water Supply Plan (LWSP) as a courtesy and service to our customers.
DWR staff does not field verify data. Neither DWR, nor any other party
involved in the preparation of this LWSP attests that the data is completely
free of errors and omissions. Furthermore, data users are cautioned that
LWSPs labeled PROVISIONAL have yet to be reviewed by DWR staff. Subsequent
review may result in significant revision. Questions regarding the accuracy
or limitations of usage of this data should be directed to the water system
and/or DWR.
|