|
The Division of Water Resources (DWR) provides the data contained within this
Local Water Supply Plan (LWSP) as a courtesy and service to our customers.
DWR staff does not field verify data. Neither DWR, nor any other party
involved in the preparation of this LWSP attests that the data is completely
free of errors and omissions. Furthermore, data users are cautioned that
LWSPs labeled PROVISIONAL have yet to be reviewed by DWR staff. Subsequent
review may result in significant revision. Questions regarding the accuracy
or limitations of usage of this data should be directed to the water system
and/or DWR.
1. System Information
Contact Information
Complete
| Water System Name: |
Wagram, Town of |
|
PWSID: |
03-83-020 |
| Mailing Address: | PO Box 118
Wagram, NC 28396 | Ownership: | Municipality |
| |
| Contact Person: | Ann Locklear | Title: | Town Clerk |
| Phone: | 910-369-2776 | Cell/Mobile: | -- |
| |
| Secondary Contact: | John Malone (NCRWA) | | Phone: | 336-780-0786 |
| Mailing Address: |
, NC | Cell/Mobile: | -- |
Distribution System
| Line Type |
Size Range (Inches) |
Estimated % of lines |
| Ductile Iron |
2 - 8 |
20.00 % |
| Polyvinyl Chloride |
2 - 6 |
80.00 % |
Programs
Town works with NCRWA when leaks need to be found. Water Conservation
2. Water Use Information
Service Area
| Sub-Basin(s) | % of Service Population |
|---|
| Big Shoe Heel Creek (09-2) | 50 % |
| Lumber River (09-1) | 50 % |
|
| County(s) | % of Service Population |
|---|
| Scotland | 100 % |
|
Population set at 965 per NCDEQ Drinking water watch website. Calculated under current active reported connections is 851 @ 2.54 per household. Will leave population at 965 until number of connections verified in new billing system. Water Use by Type
| Type of Use |
Metered
Connections |
Metered
Average Use (MGD) |
Non-Metered
Connections |
Non-Metered
Estimated Use (MGD) |
| Residential |
271 |
0.0349 |
0 |
0.0000 |
| Commercial |
61 |
0.0088 |
0 |
0.0000 |
| Industrial |
1 |
0.0006 |
0 |
0.0000 |
| Institutional |
2 |
0.0029 |
0 |
0.0000 |
How much water was used for system processes (backwash, line cleaning, flushing, etc.)? 0.0017 MGD
January and February water use by type had to be estimated due to data loss during billing system upgrade. Estimated based on average % of withdrawal to use by type. There are 37 fewer connections shown from the previous year in the new billing system. The correct number of connections cannot be verified at this time. System process water higher than expected due to tower overflows. There were at least 2 water leaks that were known that leaked for in excess of six months. There was no estimate available for rate of each leak. Leaks were not accounted for in system process water and will show as unaccounted for water. 3. Water Supply Sources
Monthly Withdrawals & Purchases
|
Average Daily
Use (MGD) |
Max Day
Use (MGD) |
|
Average Daily
Use (MGD) |
Max Day
Use (MGD) |
|
Average Daily
Use (MGD) |
Max Day
Use (MGD) |
| Jan |
0.0699 |
0.0698 |
May |
0.0667 |
0.0865 |
Sep |
0.0682 |
0.0748 |
| Feb |
0.0700 |
0.0769 |
Jun |
0.0707 |
0.0756 |
Oct |
0.0726 |
0.1691 |
| Mar |
0.0688 |
0.1502 |
Jul |
0.0705 |
0.0805 |
Nov |
0.0831 |
0.0746 |
| Apr |
0.0696 |
0.0774 |
Aug |
0.0599 |
0.0737 |
Dec |
0.0612 |
0.0829 |
Tower Overflows caused high max days in Mar & Oct. Monthly values will not match the MOR (GWMOR) report for some months, errors were found and corrected prior to entry here. 
Ground Water Sources
| Name or Number |
Average Daily Withdrawal (MGD) |
Max Day Withdrawal (MGD) |
12-Hour Supply
(MGD) |
CUA Reduction |
Year Offline |
Use Type |
| MGD |
Days Used |
| Well #3 |
0.0679 |
161 |
0.1389 |
0.0950 |
|
|
Regular |
| Well #6 |
0.0704 |
205 |
0.1691 |
0.1250 |
|
|
Regular |
Ground Water Sources (continued)
| Name or Number |
Well Depth (Feet) |
Casing Depth
(Feet) |
Screen Depth (Feet) |
Well Diameter (Inches) |
Pump Intake Depth (Feet) |
Metered? |
| Top |
Bottom |
| Well #3 |
63 |
47 |
47 |
57 |
8 |
46 |
Yes |
| Well #6 |
115 |
52 |
52 |
110 |
8 |
50 |
Yes |
Max days from the wells caused by tower overflows.
Wagram Wellhead Protection Plan #111 - Approved: October 19, 2007 - 2 Wells
4. Wastewater Information
Monthly Discharges
|
Average Daily
Discharge (MGD) |
|
Average Daily
Discharge (MGD) |
|
Average Daily
Discharge (MGD) |
| Jan |
0.0401 |
May |
0.0394 |
Sep |
0.0388 |
| Feb |
0.0549 |
Jun |
0.0414 |
Oct |
0.0411 |
| Mar |
0.0423 |
Jul |
0.0657 |
Nov |
0.0410 |
| Apr |
0.0379 |
Aug |
0.0467 |
Dec |
0.0327 |
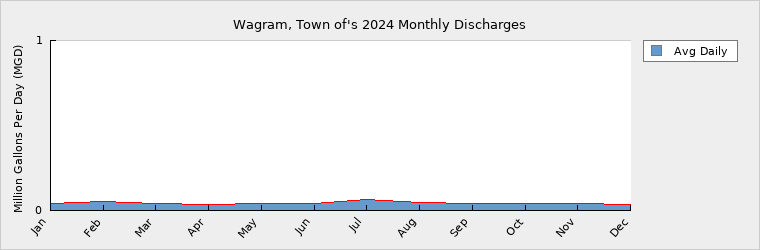
Discharge is to Laurinburg / Maxton Airport for treatment. Wastewater Interconnections
| Water System |
PWSID |
Type |
Average Daily Amount |
Contract
Maximum (MGD) |
| MGD |
Days Used |
| Laurinburg-Maxton Airport |
03-83-107 |
Discharging |
0.0436 |
366 |
0.1000 |
5. Planning
Projections
| |
2024 |
2030 |
2040 |
2050 |
2060 |
2070 |
| Year-Round Population |
965 |
842 |
660 |
517 |
405 |
317 |
| Seasonal Population |
0 |
0 |
0 |
0 |
0 |
0 |
| |
| Residential |
0.0349 |
0.0304 |
0.0238 |
0.0186 |
0.0145 |
0.0113 |
| Commercial |
0.0088 |
0.0077 |
0.0060 |
0.0047 |
0.0037 |
0.0029 |
| Industrial |
0.0006 |
0.0006 |
0.0006 |
0.0006 |
0.0006 |
0.0006 |
| Institutional |
0.0029 |
0.0025 |
0.0020 |
0.0015 |
0.0012 |
0.0009 |
| System Process |
0.0017 |
0.0017 |
0.0017 |
0.0017 |
0.0017 |
0.0017 |
| Unaccounted-for |
0.0204 |
0.0123 |
0.0098 |
0.0078 |
0.0063 |
0.0050 |
The Town of Wagram has a negative growth rate of 2.68% per the 2020 census data (change in population 2010-2020). Demand v/s Percent of Supply
| |
2024 |
2030 |
2040 |
2050 |
2060 |
2070 |
| Surface Water Supply |
0.0000 |
0.0000 |
0.0000 |
0.0000 |
0.0000 |
0.0000 |
| Ground Water Supply |
0.2200 |
0.2200 |
0.2200 |
0.2200 |
0.2200 |
0.2200 |
| Purchases |
0.0000 |
0.0000 |
0.0000 |
0.0000 |
0.0000 |
0.0000 |
| Future Supplies |
0.0000 |
0.0000 |
0.0000 |
0.0000 |
0.0000 |
| Total Available Supply (MGD) |
0.2200 |
0.2200 |
0.2200 |
0.2200 |
0.2200 |
0.2200 |
| Service Area Demand |
0.0693 |
0.0552 |
0.0439 |
0.0349 |
0.0280 |
0.0224 |
| Sales |
0.0000 |
0.0000 |
0.0000 |
0.0000 |
0.0000 |
0.0000 |
| Future Sales |
0.0000 |
0.0000 |
0.0000 |
0.0000 |
0.0000 |
| Total Demand (MGD) |
0.0693 |
0.0552 |
0.0439 |
0.0349 |
0.0280 |
0.0224 |
| Demand as Percent of Supply |
32% |
25% |
20% |
16% |
13% |
10% |

The purpose of the above chart is to show a general indication of how the long-term per capita water demand changes over time. The per capita water demand may actually be different than indicated due to seasonal populations and the accuracy of data submitted. Water systems that have calculated long-term per capita water demand based on a methodology that produces different results may submit their information in the notes field.
Your long-term water demand is 36 gallons per capita per day. What demand management practices do you plan to implement to reduce the per capita water demand (i.e. conduct regular water audits, implement a plumbing retrofit program, employ practices such as rainwater harvesting or reclaimed water)? If these practices are covered elsewhere in your plan, indicate where the practices are discussed here.
NO Changes
Are there other demand management practices you will implement to reduce your future supply needs? No Changes
What supplies other than the ones listed in future supplies are being considered to meet your future supply needs? None
How does the water system intend to implement the demand management and supply planning components above? N/A
Additional Information
Has this system participated in regional water supply or water use planning? No
What major water supply reports or studies were used for planning?
Please describe any other needs or issues regarding your water supply sources, any water system deficiencies or needed improvements (storage, treatment, etc.) or your ability to meet present and future water needs. Include both quantity and quality considerations, as well as financial, technical, managerial, permitting, and compliance issues: None
The Division of Water Resources (DWR) provides the data contained within this
Local Water Supply Plan (LWSP) as a courtesy and service to our customers.
DWR staff does not field verify data. Neither DWR, nor any other party
involved in the preparation of this LWSP attests that the data is completely
free of errors and omissions. Furthermore, data users are cautioned that
LWSPs labeled PROVISIONAL have yet to be reviewed by DWR staff. Subsequent
review may result in significant revision. Questions regarding the accuracy
or limitations of usage of this data should be directed to the water system
and/or DWR.
|