|
The Division of Water Resources (DWR) provides the data contained within this
Local Water Supply Plan (LWSP) as a courtesy and service to our customers.
DWR staff does not field verify data. Neither DWR, nor any other party
involved in the preparation of this LWSP attests that the data is completely
free of errors and omissions. Furthermore, data users are cautioned that
LWSPs labeled PROVISIONAL have yet to be reviewed by DWR staff. Subsequent
review may result in significant revision. Questions regarding the accuracy
or limitations of usage of this data should be directed to the water system
and/or DWR.
1. System Information
Contact Information
Complete
| Water System Name: |
Raleigh |
|
PWSID: |
03-92-010 |
| Mailing Address: | P.O. Box 590
Raleigh, NC 27602 | Ownership: | Municipality |
| |
| Contact Person: | Edward Buchan | Title: | Assistant Director |
| Phone: | 919-996-3471 | Cell/Mobile: | 919-760-0688 |
Distribution System
| Line Type |
Size Range (Inches) |
Estimated % of lines |
| Asbestos Cement |
6-8 |
2.38 % |
| Cast Iron |
4-12 |
12.27 % |
| Ductile Iron |
3-54 |
62.73 % |
| Galvanized Iron |
1-4 |
0.72 % |
| Other |
1-12 |
11.23 % |
| Polyvinyl Chloride |
2-12 |
10.67 % |
Programs
Data loggers and acoustic sensors are used to verify leaks. Pilot testing AMI pressure sensors to also help identify leaks and unusual pressure changes. Water Conservation
Reclaimed water value only includes reclaimed water distribution system customers and not water used at the Neuse River Resource Recovery Facility for irrigation. 2. Water Use Information
Service Area
| Sub-Basin(s) | % of Service Population |
|---|
| Neuse River (10-1) | 99 % |
| Contentnea Creek (10-2) | 1 % |
|
| County(s) | % of Service Population |
|---|
| Wake | 100 % |
|
Water Use by Type
| Type of Use |
Metered
Connections |
Metered
Average Use (MGD) |
Non-Metered
Connections |
Non-Metered
Estimated Use (MGD) |
| Residential |
200,520 |
35.7000 |
0 |
0.0000 |
| Commercial |
13,615 |
11.7000 |
0 |
0.0000 |
| Industrial |
1,242 |
2.6000 |
0 |
0.0000 |
| Institutional |
111 |
6.3000 |
0 |
0.0000 |
How much water was used for system processes (backwash, line cleaning, flushing, etc.)? 1.3000 MGD
Residential values include multi-family accounts. ~0.9 MGD of process water is recycled at WTPs. Water Sales
| Purchaser |
PWSID |
Average
Daily Sold
(MGD) |
Days
Used |
Contract |
Required to
comply with water
use restrictions? |
Pipe Size(s)
(Inches) |
Use
Type |
| MGD |
Expiration |
Recurring |
| Cary |
03-92-020 |
0.0000 |
0 |
0.0000 |
2032 |
Yes |
No |
24 |
Emergency |
| City of Durham |
03-32-010 |
0.0000 |
0 |
|
2026 |
Yes |
Yes |
24 |
Emergency |
| Franklin County |
02-35-030 |
0.2700 |
366 |
0.4000 |
2030 |
Yes |
No |
|
Regular |
| Fuquay-Varina |
03-92-055 |
1.1900 |
366 |
1.7500 |
2035 |
No |
Yes |
16 |
Regular |
| Holly Springs |
03-92-050 |
0.0000 |
0 |
1.2000 |
2029 |
No |
No |
16 |
Emergency |
| Johnston County |
03-51-070 |
0.8500 |
366 |
2.5000 |
2031 |
No |
No |
16 |
Regular |
3. Water Supply Sources
Monthly Withdrawals & Purchases
|
Average Daily
Use (MGD) |
Max Day
Use (MGD) |
|
Average Daily
Use (MGD) |
Max Day
Use (MGD) |
|
Average Daily
Use (MGD) |
Max Day
Use (MGD) |
| Jan |
54.3677 |
64.3000 |
May |
60.6845 |
72.9600 |
Sep |
61.6123 |
69.4600 |
| Feb |
53.3553 |
58.4000 |
Jun |
70.7123 |
80.4000 |
Oct |
64.3270 |
76.6500 |
| Mar |
54.6372 |
67.1300 |
Jul |
66.5211 |
76.9000 |
Nov |
58.3640 |
67.0900 |
| Apr |
59.4716 |
70.8800 |
Aug |
65.1655 |
80.4600 |
Dec |
55.1615 |
59.4100 |

Surface Water Sources
| Stream |
Reservoir |
Average Daily Withdrawal |
Maximum Day
Withdrawal (MGD) |
Available Raw
Water Supply |
Usable On-Stream
Raw Water Supply
Storage (MG) |
| MGD |
Days Used |
MGD |
* Qualifier |
| Neuse River |
Falls Lake |
48.6815 |
366 |
68.4400 |
88.2000 |
SY50 |
18,800.0000 |
| Swift Creek |
Lake Benson |
11.4829 |
366 |
13.4400 |
11.2000 |
SY50 |
2,085.0000 |
* Qualifier: C=Contract Amount, SY20=20-year Safe Yield, SY50=50-year Safe Yield, F=20% of 7Q10 or other instream flow requirement, CUA=Capacity Use Area Permit
Surface Water Sources (continued)
| Stream |
Reservoir |
Drainage Area
(sq mi) |
Metered? |
Sub-Basin |
County |
Year
Offline |
Use
Type |
| Neuse River |
Falls Lake |
772 |
Yes |
Neuse River (10-1) |
Wake |
|
Regular |
| Swift Creek |
Lake Benson |
36 |
Yes |
Neuse River (10-1) |
Wake |
|
Regular |
Water Purchases From Other Systems
| Seller |
PWSID |
Average
Daily Purchased
(MGD) |
Days
Used |
Contract |
Required to
comply with water
use restrictions? |
Pipe Size(s)
(Inches) |
Use
Type |
| MGD |
Expiration |
Recurring |
| Cary |
03-92-020 |
0.0000 |
0 |
0.0000 |
2032 |
Yes |
No |
24 |
Emergency |
| Durham |
03-32-010 |
0.0000 |
0 |
0.0000 |
2026 |
Yes |
No |
24 |
Emergency |
| Johnston County |
03-51-070 |
0.0000 |
0 |
2.5000 |
2031 |
No |
Yes |
16 |
Emergency |
Water Treatment Plants
| Plant Name |
Permitted Capacity
(MGD) |
Is Raw Water Metered? |
Is Finished Water Ouput Metered? |
Source |
| Dempsey E. Benton WTP |
16.0000 |
Yes |
Yes |
Lake Benson |
| E.M. Johnson WTP |
86.0000 |
Yes |
Yes |
Falls Lake |
Expanding the EM Johnson plant to 120 MGD 4. Wastewater Information
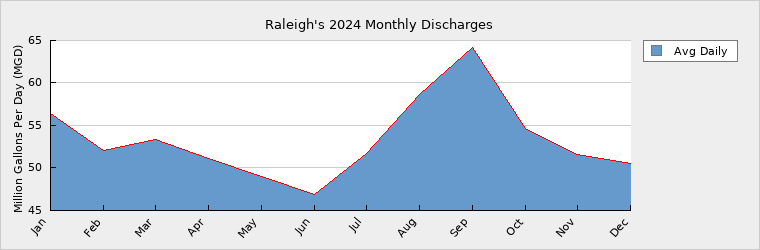
Monthly Discharges
|
Average Daily
Discharge (MGD) |
|
Average Daily
Discharge (MGD) |
|
Average Daily
Discharge (MGD) |
| Jan |
56.3800 |
May |
49.0500 |
Sep |
64.1900 |
| Feb |
52.0200 |
Jun |
46.8300 |
Oct |
54.6100 |
| Mar |
53.4000 |
Jul |
51.7100 |
Nov |
51.5500 |
| Apr |
51.1700 |
Aug |
58.6200 |
Dec |
50.5400 |
Wastewater Permits
| Permit Number |
Type |
Permitted Capacity
(MGD) |
Design Capacity
(MGD) |
Average Annual
Daily Discharge
(MGD) |
Maximum Day Discharge
(MGD) |
Receiving Stream |
Receiving Basin |
| NC0029033 |
WWTP |
75.0000 |
75.0000 |
49.7000 |
|
Neuse River |
Neuse River (10-1) |
| NC0030759 |
WWTP |
6.0000 |
4.0000 |
2.5400 |
|
Smith Creek |
Neuse River (10-1) |
| NC0079316 |
WWTP |
2.2000 |
1.8500 |
1.0600 |
|
Little Creek |
Contentnea Creek (10-2) |
Wastewater Interconnections
| Water System |
PWSID |
Type |
Average Daily Amount |
Contract
Maximum (MGD) |
| MGD |
Days Used |
| Apex |
03-92-045 |
Receiving |
0.0000 |
0 |
1.0000 |
| Clayton |
03-51-020 |
Receiving |
0.4540 |
366 |
1.0000 |
| Johnston County |
03-51-070 |
Receiving |
0.0000 |
0 |
1.0000 |
| Middlesex |
04-64-050 |
Receiving |
0.1320 |
366 |
0.1900 |
5. Planning
Projections
| |
2024 |
2030 |
2040 |
2050 |
2060 |
2070 |
| Year-Round Population |
650,000 |
776,900 |
903,000 |
1,134,200 |
1,344,000 |
1,513,630 |
| Seasonal Population |
0 |
0 |
0 |
0 |
0 |
0 |
| |
| Residential |
35.7000 |
36.4800 |
38.6400 |
44.5500 |
50.5100 |
56.4500 |
| Commercial |
11.7000 |
16.8900 |
19.9600 |
23.0100 |
26.0900 |
29.1700 |
| Industrial |
2.6000 |
1.9600 |
2.3200 |
2.6700 |
3.0300 |
3.3900 |
| Institutional |
6.3000 |
2.9500 |
3.9400 |
4.0200 |
4.5600 |
5.1000 |
| System Process |
1.3000 |
3.0200 |
3.3000 |
3.7000 |
4.0400 |
4.4000 |
| Unaccounted-for |
0.2544 |
6.4200 |
7.5900 |
8.7500 |
9.5200 |
10.0000 |
Projected residential water demand for 2030 includes 3.80 MGD wholesale water sales which will expire before 2040.
Future Supply Sources
| Source Name |
PWSID |
Source Type |
Additional Supply |
Year Online |
Year Offline |
Type |
| Little River Reservoir |
03-92-010 |
Surface |
14.0000 |
2050 |
|
Regular |
| Neuse River Intake |
03-92-010 |
Surface |
20.0000 |
2040 |
|
Regular |
| Obermeyer gates for Lake Wheeler and Lake Benson |
03-92-010 |
Surface |
2.5000 |
2026 |
|
Regular |
Development timeframes for new water resources is highly speculative and not necessarily reflective of when a resource will come online. The EM Johnson treatment plant will be expanded to 120 MGD by ~2030. Demand v/s Percent of Supply
| |
2024 |
2030 |
2040 |
2050 |
2060 |
2070 |
| Surface Water Supply |
99.4000 |
99.4000 |
99.4000 |
99.4000 |
99.4000 |
99.4000 |
| Ground Water Supply |
0.0000 |
0.0000 |
0.0000 |
0.0000 |
0.0000 |
0.0000 |
| Purchases |
0.0000 |
0.0000 |
0.0000 |
0.0000 |
0.0000 |
0.0000 |
| Future Supplies |
2.5000 |
22.5000 |
36.5000 |
36.5000 |
36.5000 |
| Total Available Supply (MGD) |
99.4000 |
101.9000 |
121.9000 |
135.9000 |
135.9000 |
135.9000 |
| Service Area Demand |
57.8544 |
67.7200 |
75.7500 |
86.7000 |
97.7500 |
108.5100 |
| Sales |
2.3100 |
4.6500 |
0.4000 |
0.4000 |
0.4000 |
0.4000 |
| Future Sales |
0.0000 |
0.0000 |
0.0000 |
0.0000 |
0.0000 |
| Total Demand (MGD) |
60.1644 |
72.3700 |
76.1500 |
87.1000 |
98.1500 |
108.9100 |
| Demand as Percent of Supply |
61% |
71% |
62% |
64% |
72% |
80% |

The purpose of the above chart is to show a general indication of how the long-term per capita water demand changes over time. The per capita water demand may actually be different than indicated due to seasonal populations and the accuracy of data submitted. Water systems that have calculated long-term per capita water demand based on a methodology that produces different results may submit their information in the notes field.
Your long-term water demand is 55 gallons per capita per day. What demand management practices do you plan to implement to reduce the per capita water demand (i.e. conduct regular water audits, implement a plumbing retrofit program, employ practices such as rainwater harvesting or reclaimed water)? If these practices are covered elsewhere in your plan, indicate where the practices are discussed here.
No changes.
Are there other demand management practices you will implement to reduce your future supply needs? Tiered water rates, billing irrigation at highest tier and showerhead exchange program.
What supplies other than the ones listed in future supplies are being considered to meet your future supply needs? Interbasin transfers, offline quarry storage and additional conservation pool transfers in Falls Lake.
How does the water system intend to implement the demand management and supply planning components above? Raleigh Water has evaluated the listed alternate resource options through the Integrated Master Plan and will continue to review these options in the future. With projected utility rate increases needed to maintain bond ratings and appropriate CIP funding, it is expected this pricing will continue to limit overall water demands.
Additional Information
Has this system participated in regional water supply or water use planning? Yes, Yes, Raleigh Water is part of the Triangle Area Water Supply Partnership and has participated in this group's long range water supply planning process.
What major water supply reports or studies were used for planning? Integrated Master Plan which was completed in November of 2023.
Please describe any other needs or issues regarding your water supply sources, any water system deficiencies or needed improvements (storage, treatment, etc.) or your ability to meet present and future water needs. Include both quantity and quality considerations, as well as financial, technical, managerial, permitting, and compliance issues:
The Division of Water Resources (DWR) provides the data contained within this
Local Water Supply Plan (LWSP) as a courtesy and service to our customers.
DWR staff does not field verify data. Neither DWR, nor any other party
involved in the preparation of this LWSP attests that the data is completely
free of errors and omissions. Furthermore, data users are cautioned that
LWSPs labeled PROVISIONAL have yet to be reviewed by DWR staff. Subsequent
review may result in significant revision. Questions regarding the accuracy
or limitations of usage of this data should be directed to the water system
and/or DWR.
|