|
The Division of Water Resources (DWR) provides the data contained within this
Local Water Supply Plan (LWSP) as a courtesy and service to our customers.
DWR staff does not field verify data. Neither DWR, nor any other party
involved in the preparation of this LWSP attests that the data is completely
free of errors and omissions. Furthermore, data users are cautioned that
LWSPs labeled PROVISIONAL have yet to be reviewed by DWR staff. Subsequent
review may result in significant revision. Questions regarding the accuracy
or limitations of usage of this data should be directed to the water system
and/or DWR.
1. System Information
Contact Information
Complete
| Water System Name: |
Holly Springs |
|
PWSID: |
03-92-050 |
| Mailing Address: | P.O. Box 8
Holly Springs, NC 27540 | Ownership: | Municipality |
| |
| Contact Person: | Rachel Ingham, PE | Title: | Deputy Director, Water Resources |
| Phone: | 919-577-3151 | Cell/Mobile: | 919-501-0741 |
| |
| Secondary Contact: | Carrie Kennedy, PE | | Phone: | 919-567-4718 |
| Mailing Address: | 128 S. Main St.
Holly Springs, NC 27540 | Cell/Mobile: | 919-501-0741 |
Distribution System
| Line Type |
Size Range (Inches) |
Estimated % of lines |
| Asbestos Cement |
4-8 |
5.00 % |
| Ductile Iron |
6-30 |
25.00 % |
| Polyvinyl Chloride |
4-16 |
70.00 % |
Programs
Water Conservation
2. Water Use Information
Service Area
| Sub-Basin(s) | % of Service Population |
|---|
| Neuse River (10-1) | 0 % |
| Cape Fear River (02-3) | 0 % |
|
| County(s) | % of Service Population |
|---|
| Wake | 0 % |
|
Water Use by Type
| Type of Use |
Metered
Connections |
Metered
Average Use (MGD) |
Non-Metered
Connections |
Non-Metered
Estimated Use (MGD) |
| Residential |
4,263 |
0.7010 |
0 |
0.0000 |
| Commercial |
102 |
0.0540 |
0 |
0.0000 |
| Industrial |
12 |
0.0080 |
0 |
0.0000 |
| Institutional |
11 |
0.0050 |
0 |
0.0000 |
How much water was used for system processes (backwash, line cleaning, flushing, etc.)? 0.1500 MGD
3. Water Supply Sources
Monthly Withdrawals & Purchases
|
Average Daily
Use (MGD) |
Max Day
Use (MGD) |
|
Average Daily
Use (MGD) |
Max Day
Use (MGD) |
|
Average Daily
Use (MGD) |
Max Day
Use (MGD) |
| Jan |
0.6570 |
0.0000 |
May |
0.7770 |
1.7380 |
Sep |
0.7720 |
1.2070 |
| Feb |
0.6600 |
0.0000 |
Jun |
1.0570 |
3.6350 |
Oct |
0.6690 |
1.3510 |
| Mar |
0.5650 |
0.0000 |
Jul |
0.7940 |
1.2630 |
Nov |
0.6970 |
1.0440 |
| Apr |
0.7030 |
1.5650 |
Aug |
0.7470 |
1.4450 |
Dec |
1.0150 |
1.0450 |

Water Purchases From Other Systems
| Seller |
PWSID |
Average
Daily Purchased
(MGD) |
Days
Used |
Contract |
Required to
comply with water
use restrictions? |
Pipe Size(s)
(Inches) |
Use
Type |
| MGD |
Expiration |
Recurring |
| Harnett County |
03-43-045 |
1.0000 |
365 |
2.0000 |
|
|
|
30 |
Regular |
| Raleigh |
03-92-010 |
0.4870 |
365 |
1.2000 |
2017 |
|
|
16 |
Regular |
4. Wastewater Information
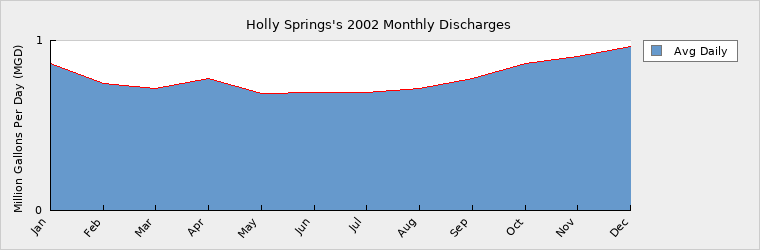
Monthly Discharges
|
Average Daily
Discharge (MGD) |
|
Average Daily
Discharge (MGD) |
|
Average Daily
Discharge (MGD) |
| Jan |
0.8630 |
May |
0.6900 |
Sep |
0.7760 |
| Feb |
0.7480 |
Jun |
0.6950 |
Oct |
0.8630 |
| Mar |
0.7190 |
Jul |
0.6970 |
Nov |
0.9080 |
| Apr |
0.7750 |
Aug |
0.7160 |
Dec |
0.9640 |
Wastewater Permits
| Permit Number |
Type |
Permitted Capacity
(MGD) |
Design Capacity
(MGD) |
Average Annual
Daily Discharge
(MGD) |
Maximum Day Discharge
(MGD) |
Receiving Stream |
Receiving Basin |
| NC 0063096 |
|
1.5000 |
1.5000 |
0.7850 |
1.9200 |
Utley Creek |
Cape Fear River (02-3) |
5. Planning
Projections
| |
2002 |
2010 |
2020 |
2030 |
| Year-Round Population |
11,580 |
37,275 |
71,400 |
103,900 |
| Seasonal Population |
0 |
0 |
0 |
0 |
| |
| Residential |
0.7010 |
2.2430 |
4.0410 |
5.8740 |
| Commercial |
0.0540 |
0.1730 |
0.4750 |
0.6910 |
| Industrial |
0.0080 |
0.0500 |
0.1430 |
0.2070 |
| Institutional |
0.0050 |
0.0250 |
0.0950 |
0.1380 |
| System Process |
0.1500 |
0.0000 |
0.0000 |
0.0000 |
| Unaccounted-for |
0.5690 |
0.2490 |
0.4750 |
0.6910 |
The percentage of residential demand has been adjusted to account for an increase in non-residential consumption Future Supply Sources
| Source Name |
PWSID |
Source Type |
Additional Supply |
Year Online |
Year Offline |
Type |
| Harnett County |
03-43-045 |
Purchase |
8.0000 |
|
|
Regular |
Demand v/s Percent of Supply
| |
2002 |
2010 |
2020 |
2030 |
| Surface Water Supply |
0.0000 |
0.0000 |
0.0000 |
0.0000 |
| Ground Water Supply |
0.0000 |
0.0000 |
0.0000 |
0.0000 |
| Purchases |
3.2000 |
3.2000 |
2.0000 |
2.0000 |
| Future Supplies |
8.0000 |
8.0000 |
8.0000 |
| Total Available Supply (MGD) |
3.2000 |
11.2000 |
10.0000 |
10.0000 |
| Service Area Demand |
1.4870 |
2.7400 |
5.2290 |
7.6010 |
| Sales |
0.0000 |
0.0000 |
0.0000 |
0.0000 |
| Future Sales |
0.0000 |
0.0000 |
0.0000 |
| Total Demand (MGD) |
1.4870 |
2.7400 |
5.2290 |
7.6010 |
| Demand as Percent of Supply |
46% |
24% |
52% |
76% |

The purpose of the above chart is to show a general indication of how the long-term per capita water demand changes over time. The per capita water demand may actually be different than indicated due to seasonal populations and the accuracy of data submitted. Water systems that have calculated long-term per capita water demand based on a methodology that produces different results may submit their information in the notes field.
Your long-term water demand is 61 gallons per capita per day. What demand management practices do you plan to implement to reduce the per capita water demand (i.e. conduct regular water audits, implement a plumbing retrofit program, employ practices such as rainwater harvesting or reclaimed water)? If these practices are covered elsewhere in your plan, indicate where the practices are discussed here.
Are there other demand management practices you will implement to reduce your future supply needs?
What supplies other than the ones listed in future supplies are being considered to meet your future supply needs?
How does the water system intend to implement the demand management and supply planning components above?
In response to 7B
The Town of Holly Springs plan for future water supply needs is inclusive of a combination of strategies, as outlined below:
1. Existing water purchase contracts provide for future additional purchases of water, as well as options to build additional plant capacity modules at those facilities. A water distribution line is already in place which will convey 10MGD from the Harnett County plant to Holly Springs (total 10MGD capacity).
2. All irrigation service customers are metered, permitting the Town to enact mandatory restrictions if necessary.
3. The Town has seasonal watering restrictions.
4. The Town is making efforts to secure a grant from the NCCWMTF in order to build Phase 1 of a reuse system that will reduce potable water needs.
5. Line flushing (new lines) is now being metered to allow for tracking of total water use for those activities (to reduce unaccounted for water). Additional Information
Has this system participated in regional water supply or water use planning? Yes
What major water supply reports or studies were used for planning? Bi-annual Water Supply Plans, internal annual updates of water usage reports.
Please describe any other needs or issues regarding your water supply sources, any water system deficiencies or needed improvements (storage, treatment, etc.) or your ability to meet present and future water needs. Include both quantity and quality considerations, as well as financial, technical, managerial, permitting, and compliance issues:
The Division of Water Resources (DWR) provides the data contained within this
Local Water Supply Plan (LWSP) as a courtesy and service to our customers.
DWR staff does not field verify data. Neither DWR, nor any other party
involved in the preparation of this LWSP attests that the data is completely
free of errors and omissions. Furthermore, data users are cautioned that
LWSPs labeled PROVISIONAL have yet to be reviewed by DWR staff. Subsequent
review may result in significant revision. Questions regarding the accuracy
or limitations of usage of this data should be directed to the water system
and/or DWR.
|