|
The Division of Water Resources (DWR) provides the data contained within this
Local Water Supply Plan (LWSP) as a courtesy and service to our customers.
DWR staff does not field verify data. Neither DWR, nor any other party
involved in the preparation of this LWSP attests that the data is completely
free of errors and omissions. Furthermore, data users are cautioned that
LWSPs labeled PROVISIONAL have yet to be reviewed by DWR staff. Subsequent
review may result in significant revision. Questions regarding the accuracy
or limitations of usage of this data should be directed to the water system
and/or DWR.
1. System Information
Contact Information
Complete
| Water System Name: |
Holly Springs |
|
PWSID: |
03-92-050 |
| Mailing Address: | P.O. Box 8
Holly Springs, NC 27540 | Ownership: | Municipality |
| |
| Contact Person: | Rachel Ingham, PE | Title: | Interim Deputy Director |
| Phone: | 919-577-3151 | Cell/Mobile: | 919-501-0741 |
| |
| Secondary Contact: | Rachel Jones | | Phone: | 919-577-3156 |
| Mailing Address: | 128 S. Main St.
Holly Springs, NC 27540 | Cell/Mobile: | -- |
Distribution System
| Line Type |
Size Range (Inches) |
Estimated % of lines |
| Asbestos Cement |
4-8 |
1.00 % |
| Ductile Iron |
2-30 |
69.00 % |
| Polyvinyl Chloride |
2-16 |
30.00 % |
Programs
The town owns 30 leak detection devices that are used to monitor the system for leaks. Water Conservation
The Town has an ILA and interconnection with the Town of Cary and Town of Apex for emergency. The Town has an interconnection with Harnett County. 2. Water Use Information
Service Area
| Sub-Basin(s) | % of Service Population |
|---|
| Neuse River (10-1) | 70 % |
| Cape Fear River (02-3) | 30 % |
|
| County(s) | % of Service Population |
|---|
| Wake | 100 % |
|
Water Use by Type
| Type of Use |
Metered
Connections |
Metered
Average Use (MGD) |
Non-Metered
Connections |
Non-Metered
Estimated Use (MGD) |
| Residential |
16,797 |
2.5310 |
0 |
0.0000 |
| Commercial |
754 |
0.3400 |
0 |
0.0000 |
| Industrial |
14 |
0.3010 |
0 |
0.0000 |
| Institutional |
93 |
0.0530 |
0 |
0.0000 |
How much water was used for system processes (backwash, line cleaning, flushing, etc.)? 0.0010 MGD
Since the system relies only on purchase water for supply, no process water is used. Reuse water is used at the WWTP for process water. The Town tracks all water for town use, such as town irrigation water, facilities, parks, and flushing water. Flushing water was estimated at 0.001 MGD based on prior year's submittals.
The Town's Finance Department has been re-evaluating all account use types, resulting in a decrease in Commercial use in 2024. 3. Water Supply Sources
Monthly Withdrawals & Purchases
|
Average Daily
Use (MGD) |
Max Day
Use (MGD) |
|
Average Daily
Use (MGD) |
Max Day
Use (MGD) |
|
Average Daily
Use (MGD) |
Max Day
Use (MGD) |
| Jan |
3.2250 |
3.5840 |
May |
3.6330 |
4.1410 |
Sep |
4.0340 |
5.2450 |
| Feb |
3.1560 |
3.3940 |
Jun |
4.6430 |
5.9530 |
Oct |
4.1090 |
4.7840 |
| Mar |
3.3470 |
3.9020 |
Jul |
4.0560 |
5.5720 |
Nov |
3.6310 |
3.9620 |
| Apr |
3.8290 |
4.5500 |
Aug |
3.9770 |
4.9180 |
Dec |
3.5690 |
3.9330 |

Water Purchases From Other Systems
| Seller |
PWSID |
Average
Daily Purchased
(MGD) |
Days
Used |
Contract |
Required to
comply with water
use restrictions? |
Pipe Size(s)
(Inches) |
Use
Type |
| MGD |
Expiration |
Recurring |
| Cary |
03-92-020 |
0.0000 |
0 |
0.0000 |
2045 |
Yes |
Yes |
16 |
Emergency |
| Harnett County |
03-43-045 |
3.7690 |
366 |
6.7000 |
2048 |
Yes |
Yes |
36 |
Regular |
The Town’s contract with Harnett County is for a maximum day use of 10 MG. However, the LWSP form does not property represent this as a max day
value, but shows it as an average day value of 10 MGD within its calculations, thus overstating the available supply. During the Jordan Lake Allocation
process, we worked with the State to develop a representative average day value for this contract. We chose to use a max month value of
approximately 6.7 MGD, which is represented throughout the LWSP. 4. Wastewater Information
Monthly Discharges
|
Average Daily
Discharge (MGD) |
|
Average Daily
Discharge (MGD) |
|
Average Daily
Discharge (MGD) |
| Jan |
2.9960 |
May |
2.7000 |
Sep |
3.0980 |
| Feb |
2.8290 |
Jun |
2.3200 |
Oct |
2.7540 |
| Mar |
3.0400 |
Jul |
2.5320 |
Nov |
2.7150 |
| Apr |
2.8740 |
Aug |
2.8260 |
Dec |
2.9130 |
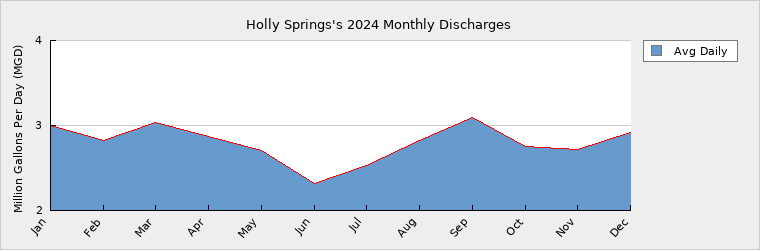
The Town is currently at 6 MGD and permitted up to 8 MGD. Design for the expansion of the Utley Creek Water Reclamation Facility (UCWRF) from 6 MGD to 8 MGD were started in early 2024 and are anticipated to be completed within five years. Wastewater Permits
| Permit Number |
Type |
Permitted Capacity
(MGD) |
Design Capacity
(MGD) |
Average Annual
Daily Discharge
(MGD) |
Maximum Day Discharge
(MGD) |
Receiving Stream |
Receiving Basin |
| NC0063096 |
WWTP |
8.0000 |
6.0000 |
2.8000 |
5.4720 |
Utley Creek |
Cape Fear River (02-3) |
5. Planning
Projections
| |
2024 |
2030 |
2040 |
2050 |
2060 |
2070 |
| Year-Round Population |
51,947 |
65,804 |
82,364 |
98,923 |
115,483 |
132,042 |
| Seasonal Population |
0 |
0 |
0 |
0 |
0 |
0 |
| |
| Residential |
2.5310 |
3.2410 |
4.0570 |
4.8730 |
5.6880 |
6.5040 |
| Commercial |
0.3400 |
0.4320 |
0.5320 |
0.6550 |
0.8060 |
0.9920 |
| Industrial |
0.3010 |
1.3000 |
1.3400 |
1.3820 |
1.4250 |
1.4700 |
| Institutional |
0.0530 |
0.0650 |
0.0800 |
0.0950 |
0.1100 |
0.1270 |
| System Process |
0.0010 |
0.0010 |
0.0010 |
0.0010 |
0.0010 |
0.0010 |
| Unaccounted-for |
0.5430 |
0.5400 |
0.6430 |
0.7490 |
0.8580 |
0.9710 |
The water use projections for Industrial users increased from last year's LWSP due to a higher level of detail being provided by the users related to anticipated water demand. Future Supply Sources
| Source Name |
PWSID |
Source Type |
Additional Supply |
Year Online |
Year Offline |
Type |
| City of Sanford |
03-53-010 |
Purchase |
4.0000 |
2026 |
|
Regular |
| Future Jordan Lake |
03-92-050 |
Surface |
2.2000 |
2030 |
|
Regular |
Sanford, Fuquay-Varina, and Holly Springs have partnered in the construction of an 18 mgd expansion of the Sanford Water Plan and will continue to expand the facility as the need arises. Demand v/s Percent of Supply
| |
2024 |
2030 |
2040 |
2050 |
2060 |
2070 |
| Surface Water Supply |
0.0000 |
0.0000 |
0.0000 |
0.0000 |
0.0000 |
0.0000 |
| Ground Water Supply |
0.0000 |
0.0000 |
0.0000 |
0.0000 |
0.0000 |
0.0000 |
| Purchases |
6.7000 |
6.7000 |
6.7000 |
6.7000 |
6.7000 |
6.7000 |
| Future Supplies |
6.2000 |
6.2000 |
6.2000 |
6.2000 |
6.2000 |
| Total Available Supply (MGD) |
6.7000 |
12.9000 |
12.9000 |
12.9000 |
12.9000 |
12.9000 |
| Service Area Demand |
3.7690 |
5.5790 |
6.6530 |
7.7550 |
8.8880 |
10.0650 |
| Sales |
0.0000 |
0.0000 |
0.0000 |
0.0000 |
0.0000 |
0.0000 |
| Future Sales |
0.0000 |
0.0000 |
0.0000 |
0.0000 |
0.0000 |
| Total Demand (MGD) |
3.7690 |
5.5790 |
6.6530 |
7.7550 |
8.8880 |
10.0650 |
| Demand as Percent of Supply |
56% |
43% |
52% |
60% |
69% |
78% |

The purpose of the above chart is to show a general indication of how the long-term per capita water demand changes over time. The per capita water demand may actually be different than indicated due to seasonal populations and the accuracy of data submitted. Water systems that have calculated long-term per capita water demand based on a methodology that produces different results may submit their information in the notes field.
Your long-term water demand is 49 gallons per capita per day. What demand management practices do you plan to implement to reduce the per capita water demand (i.e. conduct regular water audits, implement a plumbing retrofit program, employ practices such as rainwater harvesting or reclaimed water)? If these practices are covered elsewhere in your plan, indicate where the practices are discussed here.
No changes.
Are there other demand management practices you will implement to reduce your future supply needs? The Town currently enforces a Water Conservation and Water Shortage Response ordinance. The Town also has installed a water reuse system to offset potable water demands. Lastly, the Town has an active leak detection program.
What supplies other than the ones listed in future supplies are being considered to meet your future supply needs? The Town participates in regional water supply planning efforts, including the Jordan Lake Partnership, Wake County Water Partnership, and Triangle Water Partnership. Also, the Town maintains relationships with regional water suppliers such as Harnett County and the City of Sanford.
How does the water system intend to implement the demand management and supply planning components above? For demand management, the Town continues to promote the use of its reclaimed water system, growing connections to the system. For water supply planning, the Town performs routine planning for water supply to identify the timeframe of future needs and required funding for such needs.
Additional Information
Has this system participated in regional water supply or water use planning? Yes, The Town continues to participate in regional water supply planning, primarily through the Jordan Lake Partnership and the Triangle Water Supply Partnership.
What major water supply reports or studies were used for planning? Major water supply efforts and studies used in planning include the Jordan Lake Water Supply Allocation studies, the Triangle Water Supply Partnership Regional Water Supply Plan and Interconnection Model, and the Regional Water and Wastewater Infrastructure Concept Plan (NCDEQ).
Please describe any other needs or issues regarding your water supply sources, any water system deficiencies or needed improvements (storage, treatment, etc.) or your ability to meet present and future water needs. Include both quantity and quality considerations, as well as financial, technical, managerial, permitting, and compliance issues: There are no additional needs at this time, beyond those listed in this form.
The Division of Water Resources (DWR) provides the data contained within this
Local Water Supply Plan (LWSP) as a courtesy and service to our customers.
DWR staff does not field verify data. Neither DWR, nor any other party
involved in the preparation of this LWSP attests that the data is completely
free of errors and omissions. Furthermore, data users are cautioned that
LWSPs labeled PROVISIONAL have yet to be reviewed by DWR staff. Subsequent
review may result in significant revision. Questions regarding the accuracy
or limitations of usage of this data should be directed to the water system
and/or DWR.
|