|
The Division of Water Resources (DWR) provides the data contained within this
Local Water Supply Plan (LWSP) as a courtesy and service to our customers.
DWR staff does not field verify data. Neither DWR, nor any other party
involved in the preparation of this LWSP attests that the data is completely
free of errors and omissions. Furthermore, data users are cautioned that
LWSPs labeled PROVISIONAL have yet to be reviewed by DWR staff. Subsequent
review may result in significant revision. Questions regarding the accuracy
or limitations of usage of this data should be directed to the water system
and/or DWR.
1. System Information
Contact Information
Complete
| Water System Name: |
Fuquay-Varina |
|
PWSID: |
03-92-055 |
| Mailing Address: | 134 N Main Street
Fuquay-Varina, NC 27526 | Ownership: | Municipality |
| |
| Contact Person: | Mike Wagner | Title: | Public Utilities Director |
| Phone: | 919-567-3911 | Cell/Mobile: | -- |
| |
| Secondary Contact: | Chris Grimes | | Phone: | 919-753-1013 |
| Mailing Address: | 134 N Main Street
fuquay-varina, NC 27526 | Cell/Mobile: | -- |
Distribution System
| Line Type |
Size Range (Inches) |
Estimated % of lines |
| Asbestos Cement |
6-12 |
1.56 % |
| Ductile Iron |
6-24 |
26.26 % |
| Galvanized Iron |
2 |
2.60 % |
| Other |
2-10 |
12.05 % |
| Polyvinyl Chloride |
6-16 |
57.53 % |
Service lines legnths are being added into GIS and are becoming part of the total miles. Programs
Pressure loss in SCADA and AMI meters that provide feedback to potential leaks. Water Conservation
2. Water Use Information
Service Area
| Sub-Basin(s) | % of Service Population |
|---|
| Neuse River (10-1) | 60 % |
| Cape Fear River (02-3) | 40 % |
|
| County(s) | % of Service Population |
|---|
| Wake | 100 % |
|
Water Use by Type
| Type of Use |
Metered
Connections |
Metered
Average Use (MGD) |
Non-Metered
Connections |
Non-Metered
Estimated Use (MGD) |
| Residential |
19,680 |
2.2840 |
0 |
0.0000 |
| Commercial |
2,693 |
0.5670 |
0 |
0.0000 |
| Industrial |
27 |
0.2800 |
0 |
0.0000 |
| Institutional |
97 |
0.2470 |
0 |
0.0000 |
How much water was used for system processes (backwash, line cleaning, flushing, etc.)? 0.0350 MGD
Water Sales
| Purchaser |
PWSID |
Average
Daily Sold
(MGD) |
Days
Used |
Contract |
Required to
comply with water
use restrictions? |
Pipe Size(s)
(Inches) |
Use
Type |
| MGD |
Expiration |
Recurring |
| Johnston County |
03-51-070 |
0.0000 |
0 |
|
|
No |
Yes |
|
Emergency |
3. Water Supply Sources
Monthly Withdrawals & Purchases
|
Average Daily
Use (MGD) |
Max Day
Use (MGD) |
|
Average Daily
Use (MGD) |
Max Day
Use (MGD) |
|
Average Daily
Use (MGD) |
Max Day
Use (MGD) |
| Jan |
2.9020 |
3.6350 |
May |
3.6660 |
3.9660 |
Sep |
3.5800 |
3.9250 |
| Feb |
3.2380 |
3.1480 |
Jun |
4.5670 |
5.6720 |
Oct |
3.3130 |
3.7820 |
| Mar |
2.9930 |
3.3230 |
Jul |
3.8810 |
4.7380 |
Nov |
3.3040 |
3.5780 |
| Apr |
3.3160 |
4.3560 |
Aug |
3.3100 |
4.2540 |
Dec |
2.8790 |
3.5880 |

Water Purchases From Other Systems
| Seller |
PWSID |
Average
Daily Purchased
(MGD) |
Days
Used |
Contract |
Required to
comply with water
use restrictions? |
Pipe Size(s)
(Inches) |
Use
Type |
| MGD |
Expiration |
Recurring |
| City of Raleigh |
03-92-010 |
1.1900 |
366 |
1.7500 |
2035 |
No |
Yes |
12 |
Regular |
| Harnett County |
03-43-045 |
1.9217 |
366 |
4.0000 |
2032 |
Yes |
Yes |
12&24 |
Regular |
| Johnston County |
03-51-070 |
0.3438 |
366 |
1.5000 |
2049 |
No |
Yes |
16 |
Regular |
Have a bulk water agreement with Harnett County for an additional 2.000 MGD until 2032 (total of 4 MGD until 2032). 4. Wastewater Information
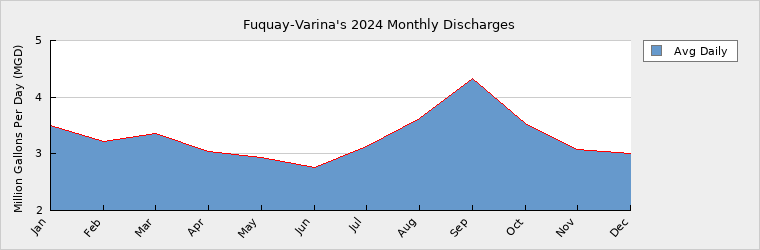
Monthly Discharges
|
Average Daily
Discharge (MGD) |
|
Average Daily
Discharge (MGD) |
|
Average Daily
Discharge (MGD) |
| Jan |
3.4990 |
May |
2.9370 |
Sep |
4.3350 |
| Feb |
3.2130 |
Jun |
2.7610 |
Oct |
3.5330 |
| Mar |
3.3530 |
Jul |
3.1250 |
Nov |
3.0770 |
| Apr |
3.0420 |
Aug |
3.6290 |
Dec |
3.0020 |
Wastewater Permits
| Permit Number |
Type |
Permitted Capacity
(MGD) |
Design Capacity
(MGD) |
Average Annual
Daily Discharge
(MGD) |
Maximum Day Discharge
(MGD) |
Receiving Stream |
Receiving Basin |
| NC0066150 |
WWTP |
0.1170 |
0.1170 |
0.0660 |
0.1070 |
Middle Creek |
Neuse River (10-1) |
| NC0066516 |
WWTP |
6.0000 |
3.0000 |
1.5160 |
3.0700 |
Terrible Creek |
Neuse River (10-1) |
Wastewater Interconnections
| Water System |
PWSID |
Type |
Average Daily Amount |
Contract
Maximum (MGD) |
| MGD |
Days Used |
| Harnett County |
03-43-045 |
Discharging |
1.7100 |
366 |
6.0000 |
5. Planning
Projections
| |
2024 |
2030 |
2040 |
2050 |
2060 |
2070 |
| Year-Round Population |
46,907 |
51,530 |
70,290 |
89,050 |
108,000 |
126,000 |
| Seasonal Population |
0 |
0 |
0 |
0 |
0 |
0 |
| |
| Residential |
2.2840 |
2.6796 |
3.6551 |
4.6600 |
5.6160 |
6.5520 |
| Commercial |
0.5670 |
0.6080 |
0.7732 |
0.9796 |
1.1825 |
1.3860 |
| Industrial |
0.2800 |
0.3159 |
0.3949 |
0.4936 |
0.6480 |
0.7560 |
| Institutional |
0.2470 |
0.2808 |
0.3650 |
0.4745 |
0.5457 |
0.6002 |
| System Process |
0.0350 |
0.1200 |
0.1320 |
0.1450 |
0.2160 |
0.2520 |
| Unaccounted-for |
0.0425 |
0.1216 |
0.1616 |
0.2051 |
0.2493 |
0.2899 |
Regarding increase in projected system process water demand -- our flushing program is very limited due to staffing compared to our system size and has taken a toll on some of the older system. With a growing system and additional staff, we will have a better flushing program as we maintain our assets and "operate" our distribution system. We hope to build up enough staff to flush during the annual conversion from chloramines to chlorine. Future Supply Sources
| Source Name |
PWSID |
Source Type |
Additional Supply |
Year Online |
Year Offline |
Type |
| City of Sanford |
03-53-010 |
Purchase |
6.0000 |
2027 |
2044 |
Regular |
| City of Sanford |
03-53-010 |
Purchase |
8.0000 |
2045 |
2049 |
Regular |
| City of Sanford |
03-53-010 |
Purchase |
10.0000 |
2050 |
2054 |
Regular |
| City of Sanford |
03-53-010 |
Purchase |
11.0000 |
2055 |
|
Regular |
The Town is currently participating with the City of Sanford and Holly Springs for the expansion of the water filtration facility, a conveyance system to deliver treated water, and an IBT request. Demand v/s Percent of Supply
| |
2024 |
2030 |
2040 |
2050 |
2060 |
2070 |
| Surface Water Supply |
0.0000 |
0.0000 |
0.0000 |
0.0000 |
0.0000 |
0.0000 |
| Ground Water Supply |
0.0000 |
0.0000 |
0.0000 |
0.0000 |
0.0000 |
0.0000 |
| Purchases |
7.2500 |
7.2500 |
5.5000 |
4.0000 |
4.0000 |
4.0000 |
| Future Supplies |
6.0000 |
6.0000 |
10.0000 |
11.0000 |
11.0000 |
| Total Available Supply (MGD) |
7.2500 |
13.2500 |
11.5000 |
14.0000 |
15.0000 |
15.0000 |
| Service Area Demand |
3.4555 |
4.1259 |
5.4818 |
6.9578 |
8.4575 |
9.8361 |
| Sales |
0.0000 |
0.0000 |
0.0000 |
0.0000 |
0.0000 |
0.0000 |
| Future Sales |
0.0000 |
0.0000 |
0.0000 |
0.0000 |
0.0000 |
| Total Demand (MGD) |
3.4555 |
4.1259 |
5.4818 |
6.9578 |
8.4575 |
9.8361 |
| Demand as Percent of Supply |
48% |
31% |
48% |
50% |
56% |
66% |

The purpose of the above chart is to show a general indication of how the long-term per capita water demand changes over time. The per capita water demand may actually be different than indicated due to seasonal populations and the accuracy of data submitted. Water systems that have calculated long-term per capita water demand based on a methodology that produces different results may submit their information in the notes field.
Your long-term water demand is 49 gallons per capita per day. What demand management practices do you plan to implement to reduce the per capita water demand (i.e. conduct regular water audits, implement a plumbing retrofit program, employ practices such as rainwater harvesting or reclaimed water)? If these practices are covered elsewhere in your plan, indicate where the practices are discussed here.
No Changes
Are there other demand management practices you will implement to reduce your future supply needs? Best management practices with developers and EPA water sense. Best practices for future reuse options.
What supplies other than the ones listed in future supplies are being considered to meet your future supply needs? Those expansions with current providers.
How does the water system intend to implement the demand management and supply planning components above? Education on best management practices and future technologies. We'll consider all resources available.
Additional Information
Has this system participated in regional water supply or water use planning? Yes, Yes, looking at regional options with Sanford, Holly Springs, and Pittsboro, the Triangle Water Partnership, and Wake County One Water.
What major water supply reports or studies were used for planning? Continue working on IBT and OASIS modeling.
Please describe any other needs or issues regarding your water supply sources, any water system deficiencies or needed improvements (storage, treatment, etc.) or your ability to meet present and future water needs. Include both quantity and quality considerations, as well as financial, technical, managerial, permitting, and compliance issues: The department and system is growing with development. We will use best management practices and sources from AWWA, WEF, EPA, NCDEQ, UNC Finance, NC League, etc..
The Division of Water Resources (DWR) provides the data contained within this
Local Water Supply Plan (LWSP) as a courtesy and service to our customers.
DWR staff does not field verify data. Neither DWR, nor any other party
involved in the preparation of this LWSP attests that the data is completely
free of errors and omissions. Furthermore, data users are cautioned that
LWSPs labeled PROVISIONAL have yet to be reviewed by DWR staff. Subsequent
review may result in significant revision. Questions regarding the accuracy
or limitations of usage of this data should be directed to the water system
and/or DWR.
|