|
The Division of Water Resources (DWR) provides the data contained within this
Local Water Supply Plan (LWSP) as a courtesy and service to our customers.
DWR staff does not field verify data. Neither DWR, nor any other party
involved in the preparation of this LWSP attests that the data is completely
free of errors and omissions. Furthermore, data users are cautioned that
LWSPs labeled PROVISIONAL have yet to be reviewed by DWR staff. Subsequent
review may result in significant revision. Questions regarding the accuracy
or limitations of usage of this data should be directed to the water system
and/or DWR.
1. System Information
Contact Information
Provisional
| Water System Name: |
Brunswick County |
|
PWSID: |
04-10-045 |
| Mailing Address: | PO Box 249
Bolivia, NC 28422 | Ownership: | County |
| |
| Contact Person: | Glenn Walker | Title: | Water Resources Manager |
| Phone: | 910-253-1776 | Cell/Mobile: | -- |
| |
| Secondary Contact: | John Nichols | | Phone: | 910-253-2657 |
| Mailing Address: | PO Box 249
Bolivia, NC 28422 | Cell/Mobile: | -- |
Distribution System
| Line Type |
Size Range (Inches) |
Estimated % of lines |
| Asbestos Cement |
2-16 |
3.96 % |
| Ductile Iron |
2-48 |
7.62 % |
| Other |
1-19 |
1.34 % |
| Polyvinyl Chloride |
1-42 |
87.08 % |
Programs
We monitor non-revenue water, we monitor flow at various points in the WS. Our billing software detects leaks on the customer meters and our SCADA system monitors pressure and flow at multiple points in the system. Fire departments flow and maintain each hydrant annually. Water Conservation
Little River Water Company, can provide up to 1.5 MGD 2. Water Use Information
Service Area
| Sub-Basin(s) | % of Service Population |
|---|
| Shallotte River (09-4) | 54 % |
| Cape Fear River (02-3) | 30 % |
| Waccamaw River (09-3) | 16 % |
|
| County(s) | % of Service Population |
|---|
| Brunswick | 100 % |
|
The utility acquired Southport WSID #04-10-010 on July 1 2024, and Shallotte WSID#04-10-025 on January 1, 2024 Water Use by Type
| Type of Use |
Metered
Connections |
Metered
Average Use (MGD) |
Non-Metered
Connections |
Non-Metered
Estimated Use (MGD) |
| Residential |
63,794 |
9.5800 |
0 |
2.6400 |
| Commercial |
0 |
0.0000 |
0 |
0.0000 |
| Industrial |
52 |
1.6156 |
0 |
0.0000 |
| Institutional |
0 |
0.0000 |
0 |
0.0000 |
How much water was used for system processes (backwash, line cleaning, flushing, etc.)? 0.7525 MGD
Water Sales
| Purchaser |
PWSID |
Average
Daily Sold
(MGD) |
Days
Used |
Contract |
Required to
comply with water
use restrictions? |
Pipe Size(s)
(Inches) |
Use
Type |
| MGD |
Expiration |
Recurring |
| Bald Head Utilities |
04-10-130 |
0.6270 |
366 |
0.5000 |
2050 |
Yes |
Yes |
10 |
Regular |
| Holden Beach |
04-10-060 |
0.4810 |
366 |
1.8000 |
2061 |
Yes |
Yes |
12-12 |
Regular |
| Little River Water Company |
00-00-000 |
0.0000 |
0 |
|
2040 |
Yes |
Yes |
12 |
Emergency |
| Oak Island |
04-10-020 |
1.2856 |
366 |
|
2061 |
Yes |
Yes |
6,12 |
Regular |
| Ocean Isle Beach |
04-10-035 |
0.6748 |
366 |
|
2040 |
Yes |
Yes |
8-12 |
Regular |
| Southport |
04-10-010 |
0.5219 |
181 |
|
2024 |
No |
Yes |
24-24 |
Regular |
Southport was absorbed into the utility July 1, 2024. 3. Water Supply Sources
Monthly Withdrawals & Purchases
|
Average Daily
Use (MGD) |
Max Day
Use (MGD) |
|
Average Daily
Use (MGD) |
Max Day
Use (MGD) |
|
Average Daily
Use (MGD) |
Max Day
Use (MGD) |
| Jan |
11.0300 |
|
May |
16.3100 |
|
Sep |
15.6800 |
|
| Feb |
10.4400 |
|
Jun |
20.6000 |
|
Oct |
16.2000 |
|
| Mar |
12.3600 |
|
Jul |
19.3500 |
|
Nov |
13.0100 |
|
| Apr |
14.5400 |
|
Aug |
16.9000 |
|
Dec |
10.1800 |
|

Ground Water Sources
| Name or Number |
Average Daily Withdrawal (MGD) |
Max Day Withdrawal (MGD) |
12-Hour Supply
(MGD) |
CUA Reduction |
Year Offline |
Use Type |
| MGD |
Days Used |
| 1 |
0.1880 |
111 |
0.224 |
0.1810 |
|
|
Regular |
| 11 |
0.9755 |
195 |
1.113 |
0.9680 |
|
|
Regular |
| 12 |
0.5560 |
196 |
0.591 |
0.4000 |
|
|
Regular |
| 12A |
0.5410 |
205 |
0.578 |
0.5490 |
|
|
Regular |
| 15 |
0.2420 |
193 |
0.360 |
0.2980 |
|
|
Regular |
| 16 |
0.7420 |
291 |
0.742 |
0.7390 |
|
|
Regular |
| 17 |
0.1680 |
191 |
0.216 |
0.1610 |
|
|
Regular |
| 18 |
0.2020 |
194 |
0.294 |
0.2350 |
|
|
Regular |
| 19 |
0.2530 |
170 |
0.375 |
0.2400 |
|
|
Regular |
| 2 |
0.0760 |
158 |
0.12 |
0.0577 |
|
|
Regular |
| 3 |
0.1650 |
188 |
0.226 |
0.1580 |
|
|
Regular |
| 5 |
0.2320 |
199 |
0.232 |
0.2310 |
|
|
Regular |
| 6A |
0.2770 |
158 |
0.509 |
0.2240 |
|
|
Regular |
| 8 |
0.7140 |
329 |
0.809 |
0.6170 |
|
|
Regular |
Ground Water Sources (continued)
| Name or Number |
Well Depth (Feet) |
Casing Depth
(Feet) |
Screen Depth (Feet) |
Well Diameter (Inches) |
Pump Intake Depth (Feet) |
Metered? |
| Top |
Bottom |
| 1 |
175 |
174 |
90 |
170 |
10 |
84 |
Yes |
| 11 |
164 |
164 |
0 |
0 |
10 |
84 |
Yes |
| 12 |
96 |
96 |
0 |
0 |
8 |
50 |
Yes |
| 12A |
114 |
114 |
60 |
110 |
10 |
63 |
Yes |
| 15 |
129 |
129 |
75 |
125 |
10 |
74 |
Yes |
| 16 |
155 |
155 |
63 |
153 |
10 |
52 |
Yes |
| 17 |
155 |
155 |
0 |
0 |
8 |
70 |
Yes |
| 18 |
155 |
155 |
0 |
0 |
10 |
0 |
Yes |
| 19 |
150 |
150 |
64 |
144 |
10 |
0 |
Yes |
| 2 |
163 |
163 |
60 |
160 |
10 |
65 |
Yes |
| 3 |
159 |
159 |
70 |
155 |
10 |
72 |
Yes |
| 5 |
156 |
156 |
68 |
148 |
10 |
73 |
Yes |
| 6A |
180 |
180 |
100 |
160 |
12 |
90 |
Yes |
| 8 |
153 |
153 |
65 |
150 |
10 |
70 |
Yes |
Water Purchases From Other Systems
| Seller |
PWSID |
Average
Daily Purchased
(MGD) |
Days
Used |
Contract |
Required to
comply with water
use restrictions? |
Pipe Size(s)
(Inches) |
Use
Type |
| MGD |
Expiration |
Recurring |
| Little River Water Company |
00-00-000 |
0.0000 |
0 |
1.5000 |
|
Yes |
Yes |
12 |
Emergency |
| Lower Cape Fear Water and Sewer Authority |
50-09-013 |
14.7200 |
366 |
50.0000 |
|
Yes |
Yes |
48-54 |
Regular |
Water Treatment Plants
| Plant Name |
Permitted Capacity
(MGD) |
Is Raw Water Metered? |
Is Finished Water Ouput Metered? |
Source |
| 211 WTP |
6.0000 |
Yes |
Yes |
Castle Hayne Aquifer |
| Northwest WTP |
24.0000 |
Yes |
Yes |
LCFWASA, (Cape Fear River) |
Northwest WTP is under construction to expand conventional capacity to 48 MGD. 4. Wastewater Information
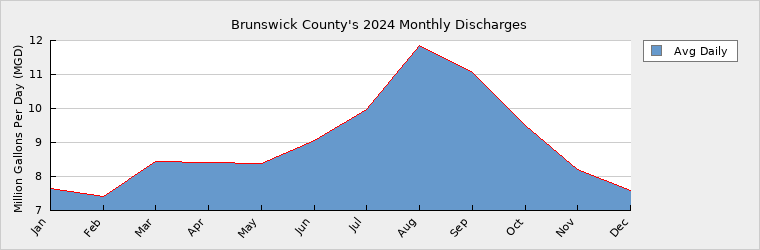
Monthly Discharges
|
Average Daily
Discharge (MGD) |
|
Average Daily
Discharge (MGD) |
|
Average Daily
Discharge (MGD) |
| Jan |
7.6559 |
May |
8.3708 |
Sep |
11.0584 |
| Feb |
7.4155 |
Jun |
9.0443 |
Oct |
9.4939 |
| Mar |
8.4558 |
Jul |
9.9831 |
Nov |
8.2131 |
| Apr |
8.4192 |
Aug |
11.8388 |
Dec |
7.5942 |
Mulberry Branch is under construction 0.75 MGD
OIB is slated for expansion +2.0 MGD
WBR is slated for expansion +6.0 MGD
NEWWTP is slated for expansion +3.75 MGD Wastewater Permits
| Permit Number |
Type |
Permitted Capacity
(MGD) |
Design Capacity
(MGD) |
Average Annual
Daily Discharge
(MGD) |
Maximum Day Discharge
(MGD) |
Receiving Stream |
Receiving Basin |
| NC0044873 |
WWTP |
0.5300 |
0.5300 |
0.4330 |
0.5286 |
Caw Caw canal |
Waccamaw River (09-3) |
| NC0086819 |
WWTP |
4.9750 |
4.9750 |
2.8065 |
8.2875 |
Cape Fear River |
Cape Fear River (02-3) |
| WQ0000798 |
WWTP |
0.5000 |
0.5000 |
0.2894 |
0.9877 |
NONE |
Shallotte River (09-4) |
| WQ0012748 |
WWTP |
0.3000 |
0.3000 |
0.1671 |
0.2490 |
NONE |
Shallotte River (09-4) |
| WQ0023693 |
WWTP |
6.0000 |
6.0000 |
4.8661 |
12.6876 |
NONE |
Shallotte River (09-4) |
| WQ006085 |
WWTP |
1.0500 |
1.0500 |
0.4082 |
0.8040 |
NONE |
Shallotte River (09-4) |
5. Planning
Projections
| |
2024 |
2030 |
2040 |
2050 |
2060 |
2070 |
| Year-Round Population |
125,404 |
153,633 |
285,175 |
337,425 |
399,116 |
469,975 |
| Seasonal Population |
27,000 |
27,000 |
27,000 |
27,000 |
27,000 |
27,000 |
| |
| Residential |
12.2200 |
16.7500 |
31.1000 |
36.8100 |
43.5400 |
51.2700 |
| Commercial |
0.0000 |
0.0000 |
0.0000 |
0.0000 |
0.0000 |
0.0000 |
| Industrial |
1.6156 |
1.8000 |
2.0000 |
2.0000 |
2.0000 |
2.0000 |
| Institutional |
0.0000 |
0.0000 |
0.0000 |
0.0000 |
0.0000 |
0.0000 |
| System Process |
0.7525 |
9.0000 |
9.0000 |
9.0000 |
9.0000 |
9.0000 |
| Unaccounted-for |
0.0178 |
1.6061 |
2.7544 |
3.2205 |
3.7798 |
4.4253 |
Future Supply Sources
| Source Name |
PWSID |
Source Type |
Additional Supply |
Year Online |
Year Offline |
Type |
| Brunswick County Water System |
04-10-045 |
Ground |
2.0000 |
2032 |
|
Regular |
| Brunswick County Water System |
04-10-045 |
Ground |
6.0000 |
2040 |
|
Regular |
| Brunswick County Water System |
04-10-045 |
Surface |
4.0000 |
2040 |
|
Regular |
| Brunswick County Water System |
04-10-045 |
Surface |
8.0000 |
2050 |
|
Regular |
| LCFWASA |
50-09-013 |
Purchase |
-5.0000 |
2027 |
|
Regular |
PCU will purchase 5 MGD of raw water from BCPU in 2027.
The County is pursuing potable resuse and support for modeling of the CFR basin for the opportunity to address and expand the safe yield in the lower Cape Fear Basin at Lock and Dam # 1. Demand v/s Percent of Supply
| |
2024 |
2030 |
2040 |
2050 |
2060 |
2070 |
| Surface Water Supply |
0.0000 |
0.0000 |
0.0000 |
0.0000 |
0.0000 |
0.0000 |
| Ground Water Supply |
5.0587 |
5.0587 |
5.0587 |
5.0587 |
5.0587 |
5.0587 |
| Purchases |
50.0000 |
50.0000 |
50.0000 |
50.0000 |
50.0000 |
50.0000 |
| Future Supplies |
-5.0000 |
7.0000 |
15.0000 |
15.0000 |
15.0000 |
| Total Available Supply (MGD) |
55.0587 |
50.0587 |
62.0587 |
70.0587 |
70.0587 |
70.0587 |
| Service Area Demand |
14.6059 |
29.1561 |
44.8544 |
51.0305 |
58.3198 |
66.6953 |
| Sales |
3.3265 |
4.3874 |
4.3874 |
4.3874 |
4.3874 |
4.3874 |
| Future Sales |
0.0000 |
0.0000 |
0.0000 |
0.0000 |
0.0000 |
| Total Demand (MGD) |
17.9324 |
33.5435 |
49.2418 |
55.4179 |
62.7072 |
71.0827 |
| Demand as Percent of Supply |
33% |
67% |
79% |
79% |
90% |
101% |

The purpose of the above chart is to show a general indication of how the long-term per capita water demand changes over time. The per capita water demand may actually be different than indicated due to seasonal populations and the accuracy of data submitted. Water systems that have calculated long-term per capita water demand based on a methodology that produces different results may submit their information in the notes field.
Your long-term water demand is 97 gallons per capita per day. What demand management practices do you plan to implement to reduce the per capita water demand (i.e. conduct regular water audits, implement a plumbing retrofit program, employ practices such as rainwater harvesting or reclaimed water)? If these practices are covered elsewhere in your plan, indicate where the practices are discussed here.
NA
Are there other demand management practices you will implement to reduce your future supply needs? NA
What supplies other than the ones listed in future supplies are being considered to meet your future supply needs? Groundwater and surface water sources are being considered in the Southwest portion of the County
How does the water system intend to implement the demand management and supply planning components above? The County would contract with a firm specializing in water supply development, funding assistance, and permitting.
The demand-to-supply ratio in the Lower Cape Fear Water and Sewer Authority (LCFWSA)- King’s Bluff Local Water Supply Plan (LWSP) is currently above 80% because the available raw water supply is fully allocated to the existing customers and partners (i.e., Brunswick County, Cape Fear Public Utility Authority, and Pender County). Based on a 7Q10 calculation, the total available supply for the system is 106 MGD at Lock & Dam No.1. Even so, the currently projected demands of all partners -- when totaled -- remain below 80% of the available raw water supply for the foreseeable future (i.e., 2050). Furthermore, all the partners have agreed not to exceed the demands currently projected in their LWSP, without notice to NCDWR, even though these amounts may remain less than what LCFWSA – King’s Bluff is obligated to sell them. However, should projected water demands of the partners increase to such amounts where the demand-to-supply ratio in the LCFWSA King’s Bluff LWSP exceeds 80%, a long-term water supply plan to address future demands would be needed, per statutory requirements, before NCDWR could approve the LWSP. Additional Information
Has this system participated in regional water supply or water use planning? Yes, We work with Lower Cape Fear Water and Sewer Authority to develop a raw water allocation for Brunswick County.
What major water supply reports or studies were used for planning? An engineering firm was used to develop recommendations.
Please describe any other needs or issues regarding your water supply sources, any water system deficiencies or needed improvements (storage, treatment, etc.) or your ability to meet present and future water needs. Include both quantity and quality considerations, as well as financial, technical, managerial, permitting, and compliance issues: The Northwest WTP is currently undergoing an expansion and modification to treat for PFAS removal and meet the growing needs of our community.
The Division of Water Resources (DWR) provides the data contained within this
Local Water Supply Plan (LWSP) as a courtesy and service to our customers.
DWR staff does not field verify data. Neither DWR, nor any other party
involved in the preparation of this LWSP attests that the data is completely
free of errors and omissions. Furthermore, data users are cautioned that
LWSPs labeled PROVISIONAL have yet to be reviewed by DWR staff. Subsequent
review may result in significant revision. Questions regarding the accuracy
or limitations of usage of this data should be directed to the water system
and/or DWR.
|