|
The Division of Water Resources (DWR) provides the data contained within this
Local Water Supply Plan (LWSP) as a courtesy and service to our customers.
DWR staff does not field verify data. Neither DWR, nor any other party
involved in the preparation of this LWSP attests that the data is completely
free of errors and omissions. Furthermore, data users are cautioned that
LWSPs labeled PROVISIONAL have yet to be reviewed by DWR staff. Subsequent
review may result in significant revision. Questions regarding the accuracy
or limitations of usage of this data should be directed to the water system
and/or DWR.
1. System Information
Contact Information
Provisional
| Water System Name: |
Bald Head Island Utilities |
|
PWSID: |
04-10-130 |
| Mailing Address: | PO Box 3009
Bald Head Island, NC 28461 | Ownership: | Municipality |
| |
| Contact Person: | Joseph P. McCann | Title: | Public Services Director |
| Phone: | 910-457-7351 | Cell/Mobile: | 910-269-6483 |
| |
| Secondary Contact: | Nate Lindsay | | Phone: | 910-269-5718 |
| Mailing Address: | 256 Edward Teach Ext..
Bald Head Island, NC 28461 | Cell/Mobile: | -- |
Distribution System
| Line Type |
Size Range (Inches) |
Estimated % of lines |
| Galvanized Iron |
2-10 |
3.00 % |
| Polyvinyl Chloride |
2-10 |
97.00 % |
Programs
Water Conservation
2. Water Use Information
Service Area
| Sub-Basin(s) | % of Service Population |
|---|
| Cape Fear River (02-3) | 100 % |
|
| County(s) | % of Service Population |
|---|
| Brunswick | 100 % |
|
Water Use by Type
| Type of Use |
Metered
Connections |
Metered
Average Use (MGD) |
Non-Metered
Connections |
Non-Metered
Estimated Use (MGD) |
| Residential |
1,321 |
0.1628 |
0 |
0.0163 |
| Commercial |
163 |
0.0554 |
23 |
0.0324 |
| Industrial |
0 |
0.0000 |
0 |
0.0000 |
| Institutional |
0 |
0.0000 |
0 |
0.0000 |
How much water was used for system processes (backwash, line cleaning, flushing, etc.)? 0.0724 MGD
3. Water Supply Sources
Monthly Withdrawals & Purchases
|
Average Daily
Use (MGD) |
Max Day
Use (MGD) |
|
Average Daily
Use (MGD) |
Max Day
Use (MGD) |
|
Average Daily
Use (MGD) |
Max Day
Use (MGD) |
| Jan |
0.2198 |
|
May |
0.2758 |
|
Sep |
0.2402 |
|
| Feb |
0.0894 |
|
Jun |
0.3816 |
|
Oct |
0.2870 |
|
| Mar |
0.1160 |
|
Jul |
0.4103 |
|
Nov |
0.2492 |
|
| Apr |
0.1854 |
|
Aug |
0.4695 |
|
Dec |
0.2020 |
|

Ground Water Sources
| Name or Number |
Average Daily Withdrawal (MGD) |
Max Day Withdrawal (MGD) |
12-Hour Supply
(MGD) |
CUA Reduction |
Year Offline |
Use Type |
| MGD |
Days Used |
| Central #1 |
0.0100 |
245 |
|
0.0180 |
|
|
Regular |
| Central #2 |
0.0165 |
365 |
|
0.0273 |
|
|
Regular |
| Contractor Well |
0.0190 |
365 |
|
0.0316 |
|
|
Regular |
| Edward Teach #1 |
0.0130 |
365 |
|
0.0208 |
|
|
Regular |
| Edward Teach #2 |
0.0222 |
215 |
|
0.0360 |
|
|
Regular |
| Federal #1 |
0.0123 |
365 |
|
0.0252 |
|
|
Regular |
| Federal #2 |
0.0170 |
365 |
|
0.0230 |
|
|
Regular |
| Federal #3 |
0.0177 |
365 |
|
0.0266 |
|
|
Regular |
| Laughing Gull |
0.0200 |
335 |
|
0.0237 |
|
|
Regular |
| Maintenance Well |
0.0000 |
0 |
|
0.0000 |
|
|
Regular |
| Muscadine #1 |
0.0183 |
365 |
|
0.0288 |
|
|
Regular |
| Muscadine #2 |
0.0177 |
365 |
|
0.0259 |
|
|
Regular |
| Office Well |
0.0103 |
335 |
|
0.0223 |
|
|
Regular |
| Public Safety |
0.0097 |
335 |
|
0.0295 |
|
|
Regular |
| Public Works |
0.0130 |
335 |
|
0.0309 |
|
|
Regular |
| Royal James #1 |
0.0070 |
335 |
|
0.0187 |
|
|
Regular |
Ground Water Sources (continued)
| Name or Number |
Well Depth (Feet) |
Casing Depth
(Feet) |
Screen Depth (Feet) |
Well Diameter (Inches) |
Pump Intake Depth (Feet) |
Metered? |
| Top |
Bottom |
| Central #1 |
62 |
52 |
52 |
62 |
2 |
55 |
Yes |
| Central #2 |
58 |
48 |
48 |
58 |
4 |
|
Yes |
| Contractor Well |
63 |
53 |
53 |
63 |
2 |
|
Yes |
| Edward Teach #1 |
63 |
53 |
53 |
63 |
2 |
|
Yes |
| Edward Teach #2 |
62 |
52 |
52 |
62 |
2 |
|
Yes |
| Federal #1 |
60 |
50 |
50 |
60 |
2 |
|
Yes |
| Federal #2 |
60 |
50 |
50 |
60 |
2 |
|
Yes |
| Federal #3 |
52 |
46 |
46 |
52 |
2 |
|
Yes |
| Laughing Gull |
64 |
54 |
54 |
64 |
2 |
|
Yes |
| Maintenance Well |
|
|
|
|
|
|
Yes |
| Muscadine #1 |
60 |
50 |
50 |
60 |
2 |
|
Yes |
| Muscadine #2 |
61 |
51 |
51 |
61 |
4 |
|
Yes |
| Office Well |
62 |
52 |
52 |
62 |
2 |
|
Yes |
| Public Safety |
52 |
45 |
45 |
52 |
2 |
49 |
Yes |
| Public Works |
54 |
46 |
46 |
54 |
2 |
|
Yes |
| Royal James #1 |
63 |
53 |
53 |
63 |
2 |
|
Yes |
Water Purchases From Other Systems
| Seller |
PWSID |
Average
Daily Purchased
(MGD) |
Days
Used |
Contract |
Required to
comply with water
use restrictions? |
Pipe Size(s)
(Inches) |
Use
Type |
| MGD |
Expiration |
Recurring |
| Brunswick County Public Utilities |
04-10-045 |
0.1935 |
366 |
0.5000 |
2031 |
Yes |
Yes |
6.5 |
Regular |
Water Treatment Plants
| Plant Name |
Permitted Capacity
(MGD) |
Is Raw Water Metered? |
Is Finished Water Ouput Metered? |
Source |
| Village of BHI Utilities |
0.3600 |
Yes |
No |
Ground Water |
4. Wastewater Information
Monthly Discharges
|
Average Daily
Discharge (MGD) |
|
Average Daily
Discharge (MGD) |
|
Average Daily
Discharge (MGD) |
| Jan |
0.0949 |
May |
0.1412 |
Sep |
0.3093 |
| Feb |
0.0900 |
Jun |
0.1935 |
Oct |
0.1842 |
| Mar |
0.1152 |
Jul |
0.2394 |
Nov |
0.1335 |
| Apr |
0.1221 |
Aug |
0.2140 |
Dec |
0.0998 |
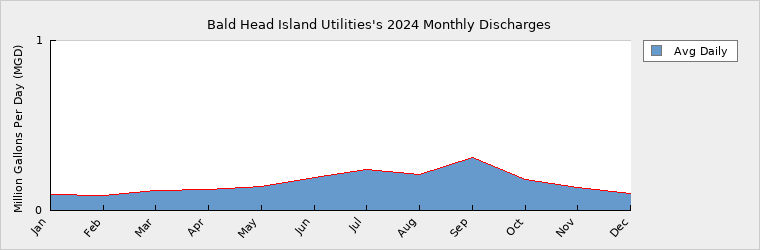
McKim and Creed Engineers are engaged to lead the VBHI WWTP expansion from 300,000 GPD to 650,000 GPD.
September 2024, the VBHI WWTP experienced high flows during a weather event PTC#8. Wastewater Permits
| Permit Number |
Type |
Permitted Capacity
(MGD) |
Design Capacity
(MGD) |
Average Annual
Daily Discharge
(MGD) |
Maximum Day Discharge
(MGD) |
Receiving Stream |
Receiving Basin |
| NC0085553 |
WTP |
0.0860 |
0.0860 |
0.0000 |
0.1000 |
Bald Head Island Marina Basin |
Cape Fear River (02-3) |
| WQ0000193 |
WWTP |
0.3000 |
0.4000 |
0.1617 |
|
Reuse and Infiltration Lagoons |
Cape Fear River (02-3) |
5. Planning
Projections
| |
2024 |
2030 |
2040 |
2050 |
2060 |
2070 |
| Year-Round Population |
3,291 |
3,300 |
3,320 |
3,325 |
3,330 |
3,335 |
| Seasonal Population |
10,000 |
10,500 |
10,600 |
10,700 |
10,700 |
10,750 |
| |
| Residential |
0.1791 |
0.1956 |
0.1956 |
0.1958 |
0.1958 |
0.1959 |
| Commercial |
0.0878 |
0.0320 |
0.0320 |
0.0325 |
0.0325 |
0.0325 |
| Industrial |
0.0000 |
0.0000 |
0.0000 |
0.0000 |
0.0000 |
0.0000 |
| Institutional |
0.0000 |
0.0000 |
0.0000 |
0.0000 |
0.0000 |
0.0000 |
| System Process |
0.0724 |
0.0091 |
0.0091 |
0.0092 |
0.0092 |
0.0093 |
| Unaccounted-for |
0.0600 |
0.1510 |
0.1510 |
0.1515 |
0.1515 |
0.1516 |
Demand v/s Percent of Supply
| |
2024 |
2030 |
2040 |
2050 |
2060 |
2070 |
| Surface Water Supply |
0.0000 |
0.0000 |
0.0000 |
0.0000 |
0.0000 |
0.0000 |
| Ground Water Supply |
0.3883 |
0.3883 |
0.3883 |
0.3883 |
0.3883 |
0.3883 |
| Purchases |
0.5000 |
0.5000 |
0.5000 |
0.5000 |
0.5000 |
0.5000 |
| Future Supplies |
0.0000 |
0.0000 |
0.0000 |
0.0000 |
0.0000 |
| Total Available Supply (MGD) |
0.8883 |
0.8883 |
0.8883 |
0.8883 |
0.8883 |
0.8883 |
| Service Area Demand |
0.3993 |
0.3877 |
0.3877 |
0.3890 |
0.3890 |
0.3893 |
| Sales |
0.0000 |
0.0000 |
0.0000 |
0.0000 |
0.0000 |
0.0000 |
| Future Sales |
0.0000 |
0.0000 |
0.0000 |
0.0000 |
0.0000 |
| Total Demand (MGD) |
0.3993 |
0.3877 |
0.3877 |
0.3890 |
0.3890 |
0.3893 |
| Demand as Percent of Supply |
45% |
44% |
44% |
44% |
44% |
44% |

The purpose of the above chart is to show a general indication of how the long-term per capita water demand changes over time. The per capita water demand may actually be different than indicated due to seasonal populations and the accuracy of data submitted. Water systems that have calculated long-term per capita water demand based on a methodology that produces different results may submit their information in the notes field.
Your long-term water demand is 54 gallons per capita per day. What demand management practices do you plan to implement to reduce the per capita water demand (i.e. conduct regular water audits, implement a plumbing retrofit program, employ practices such as rainwater harvesting or reclaimed water)? If these practices are covered elsewhere in your plan, indicate where the practices are discussed here.
no changes
Are there other demand management practices you will implement to reduce your future supply needs?
What supplies other than the ones listed in future supplies are being considered to meet your future supply needs?
How does the water system intend to implement the demand management and supply planning components above?
Additional Information
Has this system participated in regional water supply or water use planning? No
What major water supply reports or studies were used for planning?
Please describe any other needs or issues regarding your water supply sources, any water system deficiencies or needed improvements (storage, treatment, etc.) or your ability to meet present and future water needs. Include both quantity and quality considerations, as well as financial, technical, managerial, permitting, and compliance issues:
The Division of Water Resources (DWR) provides the data contained within this
Local Water Supply Plan (LWSP) as a courtesy and service to our customers.
DWR staff does not field verify data. Neither DWR, nor any other party
involved in the preparation of this LWSP attests that the data is completely
free of errors and omissions. Furthermore, data users are cautioned that
LWSPs labeled PROVISIONAL have yet to be reviewed by DWR staff. Subsequent
review may result in significant revision. Questions regarding the accuracy
or limitations of usage of this data should be directed to the water system
and/or DWR.
|