|
The Division of Water Resources (DWR) provides the data contained within this
Local Water Supply Plan (LWSP) as a courtesy and service to our customers.
DWR staff does not field verify data. Neither DWR, nor any other party
involved in the preparation of this LWSP attests that the data is completely
free of errors and omissions. Furthermore, data users are cautioned that
LWSPs labeled PROVISIONAL have yet to be reviewed by DWR staff. Subsequent
review may result in significant revision. Questions regarding the accuracy
or limitations of usage of this data should be directed to the water system
and/or DWR.
1. System Information
Contact Information
Complete
| Water System Name: |
Beaufort |
|
PWSID: |
04-16-010 |
| Mailing Address: | P.O. Box 390
Beaufort, NC 28516 | Ownership: | Municipality |
| |
| Contact Person: | Wade Keeler | Title: | Water Treatment Operator |
| Phone: | 252-728-2130 | Cell/Mobile: | 252-808-5425 |
Distribution System
| Line Type |
Size Range (Inches) |
Estimated % of lines |
| Asbestos Cement |
6,8 |
10.00 % |
| Cast Iron |
4-10 |
30.00 % |
| Ductile Iron |
6-10 |
5.00 % |
| Galvanized Iron |
1.5-2 |
10.00 % |
| Polyvinyl Chloride |
2-12 |
45.00 % |
Programs
Water Conservation
2. Water Use Information
Service Area
| Sub-Basin(s) | % of Service Population |
|---|
| White Oak River (17-1) | 100 % |
|
| County(s) | % of Service Population |
|---|
| Carteret | 100 % |
|
Water Use by Type
| Type of Use |
Metered
Connections |
Metered
Average Use (MGD) |
Non-Metered
Connections |
Non-Metered
Estimated Use (MGD) |
| Residential |
3,638 |
0.3609 |
138 |
0.0024 |
| Commercial |
272 |
0.0823 |
0 |
0.0000 |
| Industrial |
44 |
0.0193 |
0 |
0.0000 |
| Institutional |
27 |
0.0074 |
0 |
0.0000 |
How much water was used for system processes (backwash, line cleaning, flushing, etc.)? 0.0089 MGD
Water Sales
| Purchaser |
PWSID |
Average
Daily Sold
(MGD) |
Days
Used |
Contract |
Required to
comply with water
use restrictions? |
Pipe Size(s)
(Inches) |
Use
Type |
| MGD |
Expiration |
Recurring |
| North River/Mill Creek |
04-16-197 |
0.0000 |
0 |
0.0000 |
2050 |
Yes |
No |
8 |
Emergency |
3. Water Supply Sources
Monthly Withdrawals & Purchases
|
Average Daily
Use (MGD) |
Max Day
Use (MGD) |
|
Average Daily
Use (MGD) |
Max Day
Use (MGD) |
|
Average Daily
Use (MGD) |
Max Day
Use (MGD) |
| Jan |
0.4047 |
0.6351 |
May |
0.5848 |
0.8276 |
Sep |
0.5742 |
0.8332 |
| Feb |
0.4182 |
0.6034 |
Jun |
0.7399 |
0.9466 |
Oct |
0.6179 |
0.7722 |
| Mar |
0.4714 |
0.6879 |
Jul |
0.7443 |
0.9294 |
Nov |
0.5505 |
0.7500 |
| Apr |
0.4779 |
0.6092 |
Aug |
0.6747 |
0.9078 |
Dec |
0.5032 |
0.7604 |
Includes small purchase for North River system 
Ground Water Sources
| Name or Number |
Average Daily Withdrawal (MGD) |
Max Day Withdrawal (MGD) |
12-Hour Supply
(MGD) |
CUA Reduction |
Year Offline |
Use Type |
| MGD |
Days Used |
| 1 |
0.0000 |
0 |
0 |
0.0000 |
CUA0 |
|
Regular |
| 2 |
0.1538 |
366 |
0.3730 |
0.3816 |
CUA0 |
|
Regular |
| 3 |
0.1212 |
313 |
0.5420 |
0.3600 |
CUA0 |
|
Regular |
| 4 |
0.1590 |
365 |
0.4877 |
0.4680 |
CUA0 |
|
Regular |
| 5 |
0.1353 |
364 |
0.3812 |
0.4680 |
CUA0 |
|
Regular |
| TW-01 |
0.0000 |
0 |
|
0.4680 |
CUA0 |
|
Regular |
| TW-02 |
0.0000 |
0 |
0 |
0.4680 |
CUA0 |
|
Regular |
| TW-03 |
0.0000 |
0 |
0 |
0.4680 |
CUA0 |
|
Regular |
| TW-04 |
0.0000 |
0 |
0 |
0.4680 |
CUA0 |
|
Regular |
| TW-06 |
0.0000 |
0 |
0 |
0.4680 |
CUA0 |
|
Regular |
Ground Water Sources (continued)
| Name or Number |
Well Depth (Feet) |
Casing Depth
(Feet) |
Screen Depth (Feet) |
Well Diameter (Inches) |
Pump Intake Depth (Feet) |
Metered? |
| Top |
Bottom |
| 1 |
286 |
|
255 |
286 |
8 |
80 |
No |
| 2 |
390 |
|
278 |
385 |
10 |
130 |
Yes |
| 3 |
300 |
|
235 |
285 |
10 |
177 |
Yes |
| 4 |
305 |
|
245 |
300 |
12 |
235 |
Yes |
| 5 |
305 |
|
250 |
300 |
12 |
235 |
Yes |
| TW-01 |
298 |
|
238 |
293 |
12 |
200 |
No |
| TW-02 |
290 |
|
230 |
285 |
12 |
200 |
No |
| TW-03 |
290 |
|
230 |
285 |
12 |
200 |
No |
| TW-04 |
290 |
|
250 |
285 |
12 |
200 |
No |
| TW-06 |
292 |
|
237 |
287 |
12 |
200 |
No |
Water Purchases From Other Systems
| Seller |
PWSID |
Average
Daily Purchased
(MGD) |
Days
Used |
Contract |
Required to
comply with water
use restrictions? |
Pipe Size(s)
(Inches) |
Use
Type |
| MGD |
Expiration |
Recurring |
| North River/Mill Creek |
04-16-197 |
0.0134 |
365 |
0.0200 |
2050 |
Yes |
No |
8 |
Emergency |
Water Treatment Plants
| Plant Name |
Permitted Capacity
(MGD) |
Is Raw Water Metered? |
Is Finished Water Ouput Metered? |
Source |
| Glenda Drive WTP |
1.8720 |
Yes |
Yes |
Well #3 and #4 |
| Pine Street WTP |
1.8720 |
Yes |
Yes |
Well #5 and #2 |
4. Wastewater Information
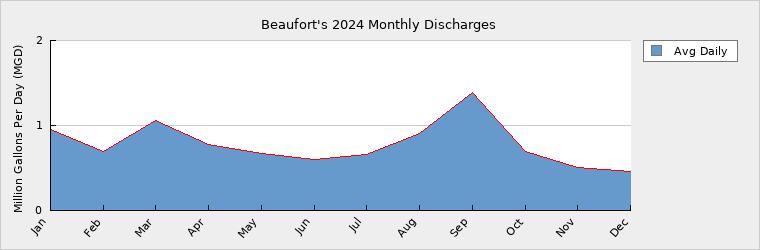
Monthly Discharges
|
Average Daily
Discharge (MGD) |
|
Average Daily
Discharge (MGD) |
|
Average Daily
Discharge (MGD) |
| Jan |
0.9515 |
May |
0.6754 |
Sep |
1.3860 |
| Feb |
0.6913 |
Jun |
0.5997 |
Oct |
0.6924 |
| Mar |
1.0577 |
Jul |
0.6560 |
Nov |
0.5031 |
| Apr |
0.7743 |
Aug |
0.9023 |
Dec |
0.4544 |
Wastewater Permits
| Permit Number |
Type |
Permitted Capacity
(MGD) |
Design Capacity
(MGD) |
Average Annual
Daily Discharge
(MGD) |
Maximum Day Discharge
(MGD) |
Receiving Stream |
Receiving Basin |
| NC0021831 |
WWTP |
1.5000 |
1.5000 |
0.7780 |
3.4000 |
Taylor Creek |
White Oak River (17-1) |
5. Planning
Projections
| |
2024 |
2030 |
2040 |
2050 |
2060 |
2070 |
| Year-Round Population |
4,804 |
5,300 |
5,800 |
6,500 |
7,200 |
7,700 |
| Seasonal Population |
10,000 |
11,250 |
12,000 |
13,500 |
14,400 |
15,400 |
| |
| Residential |
0.3633 |
0.3655 |
0.4021 |
0.4503 |
0.5269 |
0.6213 |
| Commercial |
0.0823 |
0.0953 |
0.0996 |
0.1115 |
0.1260 |
0.1424 |
| Industrial |
0.0193 |
0.0212 |
0.0234 |
0.0257 |
0.0288 |
0.0328 |
| Institutional |
0.0074 |
0.0081 |
0.0090 |
0.0098 |
0.0108 |
0.0119 |
| System Process |
0.0089 |
0.0098 |
0.0110 |
0.0125 |
0.0145 |
0.0171 |
| Unaccounted-for |
0.0827 |
0.0721 |
0.0786 |
0.0879 |
0.1020 |
0.1191 |
Demand v/s Percent of Supply
| |
2024 |
2030 |
2040 |
2050 |
2060 |
2070 |
| Surface Water Supply |
0.0000 |
0.0000 |
0.0000 |
0.0000 |
0.0000 |
0.0000 |
| Ground Water Supply |
1.8720 |
1.8720 |
1.8720 |
1.8720 |
1.8720 |
1.8720 |
| Purchases |
0.0134 |
0.0134 |
0.0134 |
0.0134 |
0.0134 |
0.0134 |
| Future Supplies |
0.0000 |
0.0000 |
0.0000 |
0.0000 |
0.0000 |
| Total Available Supply (MGD) |
1.8854 |
1.8854 |
1.8854 |
1.8854 |
1.8854 |
1.8854 |
| Service Area Demand |
0.5639 |
0.5720 |
0.6237 |
0.6977 |
0.8090 |
0.9446 |
| Sales |
0.0000 |
0.0000 |
0.0000 |
0.0000 |
0.0000 |
0.0000 |
| Future Sales |
0.0000 |
0.0000 |
0.0000 |
0.0000 |
0.0000 |
| Total Demand (MGD) |
0.5639 |
0.5720 |
0.6237 |
0.6977 |
0.8090 |
0.9446 |
| Demand as Percent of Supply |
30% |
30% |
33% |
37% |
43% |
50% |

The purpose of the above chart is to show a general indication of how the long-term per capita water demand changes over time. The per capita water demand may actually be different than indicated due to seasonal populations and the accuracy of data submitted. Water systems that have calculated long-term per capita water demand based on a methodology that produces different results may submit their information in the notes field.
Your long-term water demand is 76 gallons per capita per day. What demand management practices do you plan to implement to reduce the per capita water demand (i.e. conduct regular water audits, implement a plumbing retrofit program, employ practices such as rainwater harvesting or reclaimed water)? If these practices are covered elsewhere in your plan, indicate where the practices are discussed here.
Looks at increasing the means of production from turning new wells online, replacing old well pumps and high service pumps, or building a new water treatment plant.
Are there other demand management practices you will implement to reduce your future supply needs? Increase the amount of publication concerning low flow options and water conservation within the Town of Beaufort.
What supplies other than the ones listed in future supplies are being considered to meet your future supply needs? A new water treatment facility, current facilities are old built in the 1980s and upgrade would provide for better production with a decrease in waste.
How does the water system intend to implement the demand management and supply planning components above? Fing grant opportunities, increase in the utility rate to fund the project, training for staff currently on-board with the Town of Beaufort, a cooperative agreement with other water treatment facilities in the area, etc.
Additional Information
Has this system participated in regional water supply or water use planning? No
What major water supply reports or studies were used for planning?
Please describe any other needs or issues regarding your water supply sources, any water system deficiencies or needed improvements (storage, treatment, etc.) or your ability to meet present and future water needs. Include both quantity and quality considerations, as well as financial, technical, managerial, permitting, and compliance issues: Storage is needed at Pine Street Water Treatment Plant, currently the clearwell is a small 10,000-gallon tank. Current softeners are limited at softening water at rate of 750 gpms, current well pumps can pump at a higher rate than 750 gpms, but the system is constrained by the flow amount of the softener. New softeners would be able to increase production and provide a better product.
The Division of Water Resources (DWR) provides the data contained within this
Local Water Supply Plan (LWSP) as a courtesy and service to our customers.
DWR staff does not field verify data. Neither DWR, nor any other party
involved in the preparation of this LWSP attests that the data is completely
free of errors and omissions. Furthermore, data users are cautioned that
LWSPs labeled PROVISIONAL have yet to be reviewed by DWR staff. Subsequent
review may result in significant revision. Questions regarding the accuracy
or limitations of usage of this data should be directed to the water system
and/or DWR.
|