|
The Division of Water Resources (DWR) provides the data contained within this
Local Water Supply Plan (LWSP) as a courtesy and service to our customers.
DWR staff does not field verify data. Neither DWR, nor any other party
involved in the preparation of this LWSP attests that the data is completely
free of errors and omissions. Furthermore, data users are cautioned that
LWSPs labeled PROVISIONAL have yet to be reviewed by DWR staff. Subsequent
review may result in significant revision. Questions regarding the accuracy
or limitations of usage of this data should be directed to the water system
and/or DWR.
1. System Information
Contact Information
Complete
| Water System Name: |
Lake Waccamaw |
|
PWSID: |
04-24-045 |
| Mailing Address: | P.O. Box 145
Lake Waccamaw, NC 28450 | Ownership: | Municipality |
| |
| Contact Person: | Greg Milliken | Title: | Public Works Director |
| Phone: | 910-646-3700 | Cell/Mobile: | 910-770-2523 |
| |
| Secondary Contact: | John Malone (NCRWA) | | Phone: | -- |
| Mailing Address: |
, | Cell/Mobile: | 336-780-0786 |
Distribution System
| Line Type |
Size Range (Inches) |
Estimated % of lines |
| Ductile Iron |
4"-8" |
10.00 % |
| Polyvinyl Chloride |
2"-10 |
90.00 % |
Replaced water lines were due to DOT roadway realignment and storm drain installation. Programs
During daily routines, Town staff visually inspect the service are for signs of leaks. NCRWA is used as needed to provide leak detection services. Water Conservation
The Town is in early discussion with Columbus County for interconnection in the near future. 2. Water Use Information
Service Area
| Sub-Basin(s) | % of Service Population |
|---|
| Waccamaw River (09-3) | 100 % |
|
| County(s) | % of Service Population |
|---|
| Columbus | 100 % |
|
The 2024 population was estimated by first estimating the increase from 2023 to 2024, and then adding that increase to the 2023 population of 2469. The increase between 2023 and 2024 was estimated by multiplying the number of additional connections (49) by 2.10, the number of people per residential connection averaged over your previous five LWSPs. In doing so, this would give you an estimated 2024 residential population of 2469 + 49(2.10) = 2572. Water Use by Type
| Type of Use |
Metered
Connections |
Metered
Average Use (MGD) |
Non-Metered
Connections |
Non-Metered
Estimated Use (MGD) |
| Residential |
967 |
0.0799 |
0 |
0.0000 |
| Commercial |
31 |
0.0113 |
0 |
0.0000 |
| Industrial |
4 |
0.0077 |
0 |
0.0000 |
| Institutional |
17 |
0.0130 |
0 |
0.0000 |
How much water was used for system processes (backwash, line cleaning, flushing, etc.)? 0.0350 MGD
Water Line relocation, associated flushing and several water line breaks added to daily system process water of approximately 0.001mgd. 3. Water Supply Sources
Monthly Withdrawals & Purchases
|
Average Daily
Use (MGD) |
Max Day
Use (MGD) |
|
Average Daily
Use (MGD) |
Max Day
Use (MGD) |
|
Average Daily
Use (MGD) |
Max Day
Use (MGD) |
| Jan |
0.1212 |
|
May |
0.1508 |
|
Sep |
0.1775 |
|
| Feb |
0.1356 |
|
Jun |
0.2387 |
|
Oct |
0.1655 |
|
| Mar |
0.1600 |
|
Jul |
0.2044 |
|
Nov |
0.1664 |
|
| Apr |
0.1590 |
|
Aug |
0.1705 |
|
Dec |
0.1672 |
|

Ground Water Sources
| Name or Number |
Average Daily Withdrawal (MGD) |
Max Day Withdrawal (MGD) |
12-Hour Supply
(MGD) |
CUA Reduction |
Year Offline |
Use Type |
| MGD |
Days Used |
| Well #1 |
0.0520 |
323 |
0.143898 |
0.0900 |
|
|
Regular |
| Well #2 |
0.1195 |
364 |
0.431075 |
0.2500 |
|
|
Regular |
| Well #3 |
0.1236 |
10 |
0.273 |
0.1800 |
|
|
Regular |
Ground Water Sources (continued)
| Name or Number |
Well Depth (Feet) |
Casing Depth
(Feet) |
Screen Depth (Feet) |
Well Diameter (Inches) |
Pump Intake Depth (Feet) |
Metered? |
| Top |
Bottom |
| Well #1 |
300 |
222 |
222 |
295 |
4 |
202 |
Yes |
| Well #2 |
323 |
220 |
220 |
318 |
6 |
200 |
Yes |
| Well #3 |
335 |
260 |
260 |
330 |
10 |
168 |
Yes |
Well #3 drilled 4/5/2021, used 10 days in 2024. 4. Wastewater Information
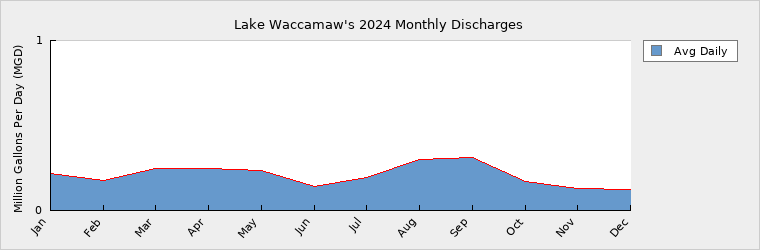
Monthly Discharges
|
Average Daily
Discharge (MGD) |
|
Average Daily
Discharge (MGD) |
|
Average Daily
Discharge (MGD) |
| Jan |
0.2200 |
May |
0.2328 |
Sep |
0.3089 |
| Feb |
0.1776 |
Jun |
0.1409 |
Oct |
0.1700 |
| Mar |
0.2471 |
Jul |
0.1937 |
Nov |
0.1306 |
| Apr |
0.2471 |
Aug |
0.3002 |
Dec |
0.1241 |
Wastewater Permits
| Permit Number |
Type |
Permitted Capacity
(MGD) |
Design Capacity
(MGD) |
Average Annual
Daily Discharge
(MGD) |
Maximum Day Discharge
(MGD) |
Receiving Stream |
Receiving Basin |
| NC0021881 |
WWTP |
0.4000 |
0.4000 |
0.2077 |
0.9000 |
Bogue Swamp |
Waccamaw River (09-3) |
Wastewater Interconnections
| Water System |
PWSID |
Type |
Average Daily Amount |
Contract
Maximum (MGD) |
| MGD |
Days Used |
| Whiteville |
04-24-010 |
Discharging |
0.0000 |
0 |
|
Connection with City of Whiteville is emergency use only. No wastewater discharged to Whiteville in 2024. 5. Planning
Projections
| |
2024 |
2030 |
2040 |
2050 |
2060 |
2070 |
| Year-Round Population |
2,572 |
2,380 |
2,100 |
1,840 |
1,620 |
1,420 |
| Seasonal Population |
3,500 |
3,500 |
3,500 |
3,500 |
3,500 |
3,500 |
| |
| Residential |
0.0799 |
0.0769 |
0.0687 |
0.0614 |
0.0548 |
0.0489 |
| Commercial |
0.0113 |
0.0109 |
0.0097 |
0.0087 |
0.0078 |
0.0069 |
| Industrial |
0.0077 |
0.0077 |
0.0077 |
0.0077 |
0.0077 |
0.0077 |
| Institutional |
0.0130 |
0.0125 |
0.0112 |
0.0100 |
0.0089 |
0.0080 |
| System Process |
0.0350 |
0.0100 |
0.0100 |
0.0100 |
0.0100 |
0.0100 |
| Unaccounted-for |
0.0212 |
0.0157 |
0.0142 |
0.0128 |
0.0116 |
0.0105 |
Negative Growth rate of 1.2% based on change in population 2020-2010 census data. Future Supply Sources
| Source Name |
PWSID |
Source Type |
Additional Supply |
Year Online |
Year Offline |
Type |
| Well #4 |
04-24-045 |
Ground |
0.1800 |
2026 |
|
Regular |
Well #4 has not started construction but is approved as part of the same project as Well #3. Well 4 is expected to be complete by 2026. Demand v/s Percent of Supply
| |
2024 |
2030 |
2040 |
2050 |
2060 |
2070 |
| Surface Water Supply |
0.0000 |
0.0000 |
0.0000 |
0.0000 |
0.0000 |
0.0000 |
| Ground Water Supply |
0.5200 |
0.5200 |
0.5200 |
0.5200 |
0.5200 |
0.5200 |
| Purchases |
0.0000 |
0.0000 |
0.0000 |
0.0000 |
0.0000 |
0.0000 |
| Future Supplies |
0.1800 |
0.1800 |
0.1800 |
0.1800 |
0.1800 |
| Total Available Supply (MGD) |
0.5200 |
0.7000 |
0.7000 |
0.7000 |
0.7000 |
0.7000 |
| Service Area Demand |
0.1681 |
0.1337 |
0.1215 |
0.1106 |
0.1008 |
0.0920 |
| Sales |
0.0000 |
0.0000 |
0.0000 |
0.0000 |
0.0000 |
0.0000 |
| Future Sales |
0.0000 |
0.0000 |
0.0000 |
0.0000 |
0.0000 |
| Total Demand (MGD) |
0.1681 |
0.1337 |
0.1215 |
0.1106 |
0.1008 |
0.0920 |
| Demand as Percent of Supply |
32% |
19% |
17% |
16% |
14% |
13% |

The purpose of the above chart is to show a general indication of how the long-term per capita water demand changes over time. The per capita water demand may actually be different than indicated due to seasonal populations and the accuracy of data submitted. Water systems that have calculated long-term per capita water demand based on a methodology that produces different results may submit their information in the notes field.
Your long-term water demand is 31 gallons per capita per day. What demand management practices do you plan to implement to reduce the per capita water demand (i.e. conduct regular water audits, implement a plumbing retrofit program, employ practices such as rainwater harvesting or reclaimed water)? If these practices are covered elsewhere in your plan, indicate where the practices are discussed here.
No Changes
Are there other demand management practices you will implement to reduce your future supply needs? No Changes
What supplies other than the ones listed in future supplies are being considered to meet your future supply needs? No Changes
How does the water system intend to implement the demand management and supply planning components above? N/A
Additional Information
Has this system participated in regional water supply or water use planning? No
What major water supply reports or studies were used for planning?
Please describe any other needs or issues regarding your water supply sources, any water system deficiencies or needed improvements (storage, treatment, etc.) or your ability to meet present and future water needs. Include both quantity and quality considerations, as well as financial, technical, managerial, permitting, and compliance issues: None.
The Division of Water Resources (DWR) provides the data contained within this
Local Water Supply Plan (LWSP) as a courtesy and service to our customers.
DWR staff does not field verify data. Neither DWR, nor any other party
involved in the preparation of this LWSP attests that the data is completely
free of errors and omissions. Furthermore, data users are cautioned that
LWSPs labeled PROVISIONAL have yet to be reviewed by DWR staff. Subsequent
review may result in significant revision. Questions regarding the accuracy
or limitations of usage of this data should be directed to the water system
and/or DWR.
|