|
The Division of Water Resources (DWR) provides the data contained within this
Local Water Supply Plan (LWSP) as a courtesy and service to our customers.
DWR staff does not field verify data. Neither DWR, nor any other party
involved in the preparation of this LWSP attests that the data is completely
free of errors and omissions. Furthermore, data users are cautioned that
LWSPs labeled PROVISIONAL have yet to be reviewed by DWR staff. Subsequent
review may result in significant revision. Questions regarding the accuracy
or limitations of usage of this data should be directed to the water system
and/or DWR.
1. System Information
Contact Information
Complete
| Water System Name: |
Bolton, Town of |
|
PWSID: |
04-24-050 |
| Mailing Address: | PO Box 327
Bolton, NC 28423 | Ownership: | Municipality |
| |
| Contact Person: | Leonard Hall | Title: | Contract ORC |
| Phone: | 910-655-8945 | Cell/Mobile: | 910-622-6932 |
| |
| Secondary Contact: | John Malone (NCRWA) | | Phone: | 336-780-0786 |
| Mailing Address: |
, | Cell/Mobile: | 336-780-0786 |
Distribution System
| Line Type |
Size Range (Inches) |
Estimated % of lines |
| Ductile Iron |
2-8 |
20.00 % |
| Polyvinyl Chloride |
2-8 |
80.00 % |
All meters were replaced in 2023. Programs
NCRWA provides leak detection on an as needed basis. Water Conservation
2. Water Use Information
Service Area
| Sub-Basin(s) | % of Service Population |
|---|
| Waccamaw River (09-3) | 100 % |
|
| County(s) | % of Service Population |
|---|
| Columbus | 100 % |
|
Water Use by Type
| Type of Use |
Metered
Connections |
Metered
Average Use (MGD) |
Non-Metered
Connections |
Non-Metered
Estimated Use (MGD) |
| Residential |
262 |
0.0268 |
0 |
0.0000 |
| Commercial |
2 |
0.0003 |
0 |
0.0000 |
| Industrial |
0 |
0.0000 |
0 |
0.0000 |
| Institutional |
0 |
0.0000 |
0 |
0.0000 |
How much water was used for system processes (backwash, line cleaning, flushing, etc.)? 0.0110 MGD
All active customer meters were replaced in 2023. New Billing Software was utilized beginning in March of 2024. Prior to software change meter reads were estimated, meter reads began after software conversion. Estimated use calculations may not reflect actual consumption during the 1st & 2nd quarters of 2024. The unaccounted-for water is expected to drop next year with a full year of working customer meters and planned water distribution system improvements.
Process water use is estimated. 3. Water Supply Sources
Monthly Withdrawals & Purchases
|
Average Daily
Use (MGD) |
Max Day
Use (MGD) |
|
Average Daily
Use (MGD) |
Max Day
Use (MGD) |
|
Average Daily
Use (MGD) |
Max Day
Use (MGD) |
| Jan |
0.0645 |
0.1010 |
May |
0.0611 |
0.0890 |
Sep |
0.0670 |
0.0920 |
| Feb |
0.0602 |
0.0870 |
Jun |
0.0633 |
0.0910 |
Oct |
0.0627 |
0.0860 |
| Mar |
0.0544 |
0.0820 |
Jul |
0.0647 |
0.1190 |
Nov |
0.0695 |
0.0890 |
| Apr |
0.0729 |
0.0800 |
Aug |
0.0775 |
0.1140 |
Dec |
0.0573 |
0.0820 |

Ground Water Sources
| Name or Number |
Average Daily Withdrawal (MGD) |
Max Day Withdrawal (MGD) |
12-Hour Supply
(MGD) |
CUA Reduction |
Year Offline |
Use Type |
| MGD |
Days Used |
| Well #1 |
0.0635 |
57 |
0.101 |
0.2000 |
|
|
Regular |
| Well #2 |
0.0650 |
308 |
0.119 |
0.2000 |
|
|
Regular |
Ground Water Sources (continued)
| Name or Number |
Well Depth (Feet) |
Casing Depth
(Feet) |
Screen Depth (Feet) |
Well Diameter (Inches) |
Pump Intake Depth (Feet) |
Metered? |
| Top |
Bottom |
| Well #1 |
385 |
365 |
|
|
10 |
100 |
Yes |
| Well #2 |
385 |
365 |
|
|
10 |
100 |
Yes |
The Town of Bolton has an approved well head protection plan (#147) dated 9/30/2015.
Well #1 is in process of being replaced on-site due to screen / casing failure. (May 2025) 4. Wastewater Information
Monthly Discharges
|
Average Daily
Discharge (MGD) |
|
Average Daily
Discharge (MGD) |
|
Average Daily
Discharge (MGD) |
| Jan |
0.0313 |
May |
0.0255 |
Sep |
0.0322 |
| Feb |
0.0282 |
Jun |
0.0245 |
Oct |
0.0285 |
| Mar |
0.0297 |
Jul |
0.0273 |
Nov |
0.0302 |
| Apr |
0.0297 |
Aug |
0.0369 |
Dec |
0.0290 |
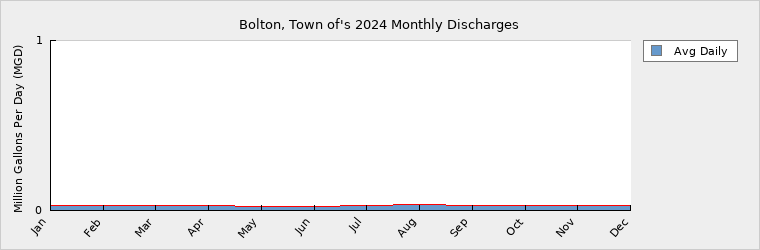
The town has no wastewater treatment facilities. All wastewater is pumped to Town of Whiteville for treatment. Wastewater Interconnections
| Water System |
PWSID |
Type |
Average Daily Amount |
Contract
Maximum (MGD) |
| MGD |
Days Used |
| City of Whiteville |
04-24-010 |
Discharging |
0.0295 |
366 |
0.1200 |
5. Planning
Projections
| |
2024 |
2030 |
2040 |
2050 |
2060 |
2070 |
| Year-Round Population |
692 |
712 |
750 |
790 |
833 |
877 |
| Seasonal Population |
0 |
0 |
0 |
0 |
0 |
0 |
| |
| Residential |
0.0268 |
0.0276 |
0.0290 |
0.0305 |
0.0321 |
0.0338 |
| Commercial |
0.0003 |
0.0035 |
0.0036 |
0.0038 |
0.0040 |
0.0042 |
| Industrial |
0.0000 |
0.0000 |
0.0000 |
0.0000 |
0.0000 |
0.0000 |
| Institutional |
0.0000 |
0.0000 |
0.0000 |
0.0000 |
0.0000 |
0.0000 |
| System Process |
0.0110 |
0.0110 |
0.0110 |
0.0110 |
0.0110 |
0.0110 |
| Unaccounted-for |
0.0265 |
0.0293 |
0.0303 |
0.0315 |
0.0328 |
0.0341 |
A negative growth rate was projected for the Town in the 2023 LWSP. In 2024 the Town added several new connections increasing its population by about 0.578%. Additional growth is expected with a new residential area planned in the next few years. Actual connections are not yet known. Demand v/s Percent of Supply
| |
2024 |
2030 |
2040 |
2050 |
2060 |
2070 |
| Surface Water Supply |
0.0000 |
0.0000 |
0.0000 |
0.0000 |
0.0000 |
0.0000 |
| Ground Water Supply |
0.4000 |
0.4000 |
0.4000 |
0.4000 |
0.4000 |
0.4000 |
| Purchases |
0.0000 |
0.0000 |
0.0000 |
0.0000 |
0.0000 |
0.0000 |
| Future Supplies |
0.0000 |
0.0000 |
0.0000 |
0.0000 |
0.0000 |
| Total Available Supply (MGD) |
0.4000 |
0.4000 |
0.4000 |
0.4000 |
0.4000 |
0.4000 |
| Service Area Demand |
0.0646 |
0.0714 |
0.0739 |
0.0768 |
0.0799 |
0.0831 |
| Sales |
0.0000 |
0.0000 |
0.0000 |
0.0000 |
0.0000 |
0.0000 |
| Future Sales |
0.0000 |
0.0000 |
0.0000 |
0.0000 |
0.0000 |
| Total Demand (MGD) |
0.0646 |
0.0714 |
0.0739 |
0.0768 |
0.0799 |
0.0831 |
| Demand as Percent of Supply |
16% |
18% |
18% |
19% |
20% |
21% |

The purpose of the above chart is to show a general indication of how the long-term per capita water demand changes over time. The per capita water demand may actually be different than indicated due to seasonal populations and the accuracy of data submitted. Water systems that have calculated long-term per capita water demand based on a methodology that produces different results may submit their information in the notes field.
Your long-term water demand is 39 gallons per capita per day. What demand management practices do you plan to implement to reduce the per capita water demand (i.e. conduct regular water audits, implement a plumbing retrofit program, employ practices such as rainwater harvesting or reclaimed water)? If these practices are covered elsewhere in your plan, indicate where the practices are discussed here.
No Changes.
Are there other demand management practices you will implement to reduce your future supply needs? No Changes.
What supplies other than the ones listed in future supplies are being considered to meet your future supply needs? None - Well #1 replacement is not listed as a future source because it is a direct replacement on-site and is not expected to increase capacity.
How does the water system intend to implement the demand management and supply planning components above? N/A
Additional Information
Has this system participated in regional water supply or water use planning? No
What major water supply reports or studies were used for planning?
Please describe any other needs or issues regarding your water supply sources, any water system deficiencies or needed improvements (storage, treatment, etc.) or your ability to meet present and future water needs. Include both quantity and quality considerations, as well as financial, technical, managerial, permitting, and compliance issues: None.
The Division of Water Resources (DWR) provides the data contained within this
Local Water Supply Plan (LWSP) as a courtesy and service to our customers.
DWR staff does not field verify data. Neither DWR, nor any other party
involved in the preparation of this LWSP attests that the data is completely
free of errors and omissions. Furthermore, data users are cautioned that
LWSPs labeled PROVISIONAL have yet to be reviewed by DWR staff. Subsequent
review may result in significant revision. Questions regarding the accuracy
or limitations of usage of this data should be directed to the water system
and/or DWR.
|