|
The Division of Water Resources (DWR) provides the data contained within this
Local Water Supply Plan (LWSP) as a courtesy and service to our customers.
DWR staff does not field verify data. Neither DWR, nor any other party
involved in the preparation of this LWSP attests that the data is completely
free of errors and omissions. Furthermore, data users are cautioned that
LWSPs labeled PROVISIONAL have yet to be reviewed by DWR staff. Subsequent
review may result in significant revision. Questions regarding the accuracy
or limitations of usage of this data should be directed to the water system
and/or DWR.
1. System Information
Contact Information
Complete
| Water System Name: |
New Bern |
|
PWSID: |
04-25-010 |
| Mailing Address: | PO Box 1129
New Bern, NC 28563-1129 | Ownership: | Municipality |
| |
| Contact Person: | Jordan B. Hughes, P.E. | Title: | Director of Water Resources |
| Phone: | 252-639-7527 | Cell/Mobile: | -- |
Distribution System
| Line Type |
Size Range (Inches) |
Estimated % of lines |
| Asbestos Cement |
6-12 |
3.78 % |
| Cast Iron |
6-12 |
8.22 % |
| Ductile Iron |
6-20 |
11.56 % |
| Galvanized Iron |
2 |
5.49 % |
| Other |
30 |
3.74 % |
| Polyvinyl Chloride |
2-18 |
67.21 % |
Programs
Leak detection is provided through AMI software and City staff notify customers when leaks are detected. Water Conservation
The City of New Bern has an emergency interconnection with the Craven County Water System. 2. Water Use Information
Service Area
| Sub-Basin(s) | % of Service Population |
|---|
| Neuse River (10-1) | 75 % |
| Trent River (10-3) | 25 % |
|
| County(s) | % of Service Population |
|---|
| Craven | 100 % |
|
2024 GIS Shapefiles provided for system mapping. Water Use by Type
| Type of Use |
Metered
Connections |
Metered
Average Use (MGD) |
Non-Metered
Connections |
Non-Metered
Estimated Use (MGD) |
| Residential |
17,440 |
2.1430 |
0 |
0.0000 |
| Commercial |
1,937 |
0.9180 |
0 |
0.0000 |
| Industrial |
30 |
0.0870 |
0 |
0.0000 |
| Institutional |
0 |
0.0000 |
0 |
0.0000 |
How much water was used for system processes (backwash, line cleaning, flushing, etc.)? 0.2380 MGD
Approximately 25 institutional type customers included in the Commercial user total. Water Sales
| Purchaser |
PWSID |
Average
Daily Sold
(MGD) |
Days
Used |
Contract |
Required to
comply with water
use restrictions? |
Pipe Size(s)
(Inches) |
Use
Type |
| MGD |
Expiration |
Recurring |
| Craven County |
04-25-055 |
0.0000 |
0 |
0.0000 |
|
Yes |
Yes |
12 |
Emergency |
While there is no formal contract that governs this connection, both parties have agreed to provide water to the other on an emergency basis. 3. Water Supply Sources
Monthly Withdrawals & Purchases
|
Average Daily
Use (MGD) |
Max Day
Use (MGD) |
|
Average Daily
Use (MGD) |
Max Day
Use (MGD) |
|
Average Daily
Use (MGD) |
Max Day
Use (MGD) |
| Jan |
3.3373 |
4.0880 |
May |
3.7305 |
5.0328 |
Sep |
3.8101 |
4.6909 |
| Feb |
3.5147 |
4.1210 |
Jun |
4.4395 |
6.2381 |
Oct |
3.7547 |
4.7520 |
| Mar |
3.3436 |
4.1570 |
Jul |
3.9444 |
5.5497 |
Nov |
3.9491 |
5.0241 |
| Apr |
3.6357 |
5.2489 |
Aug |
4.0279 |
5.3280 |
Dec |
3.5840 |
4.6740 |

Ground Water Sources
| Name or Number |
Average Daily Withdrawal (MGD) |
Max Day Withdrawal (MGD) |
12-Hour Supply
(MGD) |
CUA Reduction |
Year Offline |
Use Type |
| MGD |
Days Used |
| 1 |
1.4620 |
107 |
3.1340 |
1.0080 |
CUA25 |
|
Regular |
| 2 |
1.5501 |
76 |
2.7780 |
1.0080 |
CUA25 |
|
Regular |
| 3 |
1.4342 |
114 |
2.9480 |
1.0080 |
CUA25 |
|
Regular |
| 4 |
1.3761 |
104 |
2.8920 |
1.0080 |
CUA25 |
|
Regular |
| 5 |
1.4071 |
100 |
2.7810 |
1.0080 |
CUA25 |
|
Regular |
| WTP-1 |
0.2476 |
101 |
0.3072 |
0.2520 |
CUA0 |
|
Regular |
| WTP-10 |
0.2434 |
156 |
0.3451 |
0.4824 |
CUA0 |
|
Regular |
| WTP-11 |
0.4035 |
163 |
0.5900 |
0.7200 |
CUA0 |
|
Regular |
| WTP-12 |
0.3826 |
167 |
0.4946 |
0.5040 |
CUA0 |
|
Regular |
| WTP-13 |
0.1980 |
154 |
0.2893 |
0.3233 |
CUA0 |
|
Regular |
| WTP-14 |
0.2873 |
165 |
0.5631 |
0.3420 |
CUA0 |
|
Regular |
| WTP-15 |
0.3010 |
180 |
0.5893 |
0.7020 |
CUA0 |
|
Regular |
| WTP-2 |
0.4477 |
177 |
0.7100 |
0.2520 |
CUA0 |
|
Regular |
| WTP-3 |
0.1572 |
141 |
0.3409 |
0.2520 |
CUA0 |
|
Regular |
| WTP-4 |
0.1672 |
157 |
0.2200 |
0.2386 |
CUA0 |
|
Regular |
| WTP-5 |
0.2229 |
157 |
0.3381 |
0.4320 |
CUA0 |
|
Regular |
| WTP-6 |
0.2258 |
165 |
0.3220 |
0.5400 |
CUA0 |
|
Regular |
| WTP-7 |
0.2762 |
156 |
0.4009 |
0.4320 |
CUA0 |
|
Regular |
| WTP-8 |
0.2859 |
163 |
0.3703 |
0.5040 |
CUA0 |
|
Regular |
| WTP-9 |
0.2158 |
162 |
0.3385 |
0.5040 |
CUA0 |
|
Regular |
Ground Water Sources (continued)
| Name or Number |
Well Depth (Feet) |
Casing Depth
(Feet) |
Screen Depth (Feet) |
Well Diameter (Inches) |
Pump Intake Depth (Feet) |
Metered? |
| Top |
Bottom |
| 1 |
842 |
|
490 |
837 |
10 |
239 |
Yes |
| 2 |
820 |
|
460 |
815 |
10 |
237 |
Yes |
| 3 |
796 |
|
465 |
779 |
10 |
280 |
Yes |
| 4 |
839 |
|
465 |
834 |
10 |
260 |
Yes |
| 5 |
889 |
|
495 |
889 |
10 |
264 |
Yes |
| WTP-1 |
250 |
|
225 |
245 |
16 |
200 |
Yes |
| WTP-10 |
297 |
|
280 |
292 |
16 |
260 |
Yes |
| WTP-11 |
269 |
|
239 |
264 |
16 |
217 |
Yes |
| WTP-12 |
269 |
|
244 |
264 |
12 |
220 |
Yes |
| WTP-13 |
274 |
|
234 |
269 |
12 |
210 |
Yes |
| WTP-14 |
242 |
|
222 |
237 |
12 |
198 |
Yes |
| WTP-15 |
247 |
|
212 |
242 |
16 |
194 |
Yes |
| WTP-2 |
265 |
|
233 |
263 |
12 |
212 |
Yes |
| WTP-3 |
231 |
|
196 |
226 |
12 |
175 |
Yes |
| WTP-4 |
237 |
|
207 |
232 |
12 |
185 |
Yes |
| WTP-5 |
243 |
|
218 |
238 |
12 |
196 |
Yes |
| WTP-6 |
269 |
|
236 |
264 |
16 |
203 |
Yes |
| WTP-7 |
271 |
|
238 |
266 |
16 |
218 |
Yes |
| WTP-8 |
278 |
|
246 |
273 |
16 |
225 |
Yes |
| WTP-9 |
287 |
|
264 |
282 |
16 |
242 |
Yes |
Per as temporary permit issued 11/22/2022, the current CUA reduction for wells 1-5 is 50%, however 50% was not a selection in the drop-down menu. Therefore, 25% was selected for each of these wells. Water Purchases From Other Systems
| Seller |
PWSID |
Average
Daily Purchased
(MGD) |
Days
Used |
Contract |
Required to
comply with water
use restrictions? |
Pipe Size(s)
(Inches) |
Use
Type |
| MGD |
Expiration |
Recurring |
| Craven County |
04-25-055 |
0.0000 |
0 |
0.0000 |
|
Yes |
Yes |
12 |
Emergency |
Water Treatment Plants
| Plant Name |
Permitted Capacity
(MGD) |
Is Raw Water Metered? |
Is Finished Water Ouput Metered? |
Source |
| City of New WTP |
5.5000 |
Yes |
Yes |
Castle Hayne |
4. Wastewater Information
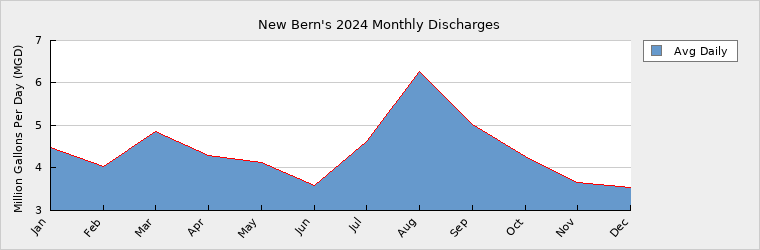
Monthly Discharges
|
Average Daily
Discharge (MGD) |
|
Average Daily
Discharge (MGD) |
|
Average Daily
Discharge (MGD) |
| Jan |
4.4770 |
May |
4.1350 |
Sep |
5.0160 |
| Feb |
4.0440 |
Jun |
3.5980 |
Oct |
4.2590 |
| Mar |
4.8690 |
Jul |
4.6270 |
Nov |
3.6530 |
| Apr |
4.2950 |
Aug |
6.2640 |
Dec |
3.5480 |
Wastewater Permits
| Permit Number |
Type |
Permitted Capacity
(MGD) |
Design Capacity
(MGD) |
Average Annual
Daily Discharge
(MGD) |
Maximum Day Discharge
(MGD) |
Receiving Stream |
Receiving Basin |
| NC0025348 |
WWTP |
6.5000 |
16.2500 |
4.4040 |
13.3000 |
Neuse River |
Neuse River (10-1) |
5. Planning
Projections
| |
2024 |
2030 |
2040 |
2050 |
2060 |
2070 |
| Year-Round Population |
40,316 |
44,100 |
51,150 |
59,400 |
68,900 |
79,900 |
| Seasonal Population |
0 |
0 |
0 |
0 |
0 |
0 |
| |
| Residential |
2.1430 |
2.3430 |
2.7190 |
3.1560 |
3.6630 |
4.2510 |
| Commercial |
0.9180 |
1.0040 |
1.1650 |
1.3520 |
1.5690 |
1.8121 |
| Industrial |
0.0870 |
0.0950 |
0.1100 |
0.1280 |
0.1490 |
0.1730 |
| Institutional |
0.0000 |
0.0000 |
0.0000 |
0.0000 |
0.0000 |
0.0000 |
| System Process |
0.2380 |
0.2600 |
0.3020 |
0.3510 |
0.4070 |
0.4720 |
| Unaccounted-for |
0.3595 |
0.3931 |
0.4561 |
0.5295 |
0.6145 |
0.7122 |
The City of New Bern was granted a temporary 5-yr permit, effective on 11-22-2022, to withdraw up to 774,920,500 GPY (2.1231 MGD) of water from the Black Creek and Upper Cape Fear aquifers. However, this 50% reduction level could be extended indefinitely if warranted by favorable hydrogeologic conditions, an evaluation that will be conducted by DEQ every five years. If not, the permit could be revoked or amended. Accordingly, the projected 2030-2070 GW supply of 2.1231 MGD (from its restricted wells) used in this Plan to calculate projected demand-to-supply ratios is based on the City getting extensions of the permit. However, if and when the permit would need to be revoked or amended, the projected GW allocations and demand-to-supply ratios would be as well. Demand v/s Percent of Supply
| |
2024 |
2030 |
2040 |
2050 |
2060 |
2070 |
| Surface Water Supply |
0.0000 |
0.0000 |
0.0000 |
0.0000 |
0.0000 |
0.0000 |
| Ground Water Supply |
7.6231 |
7.6231 |
7.6231 |
7.6231 |
7.6231 |
7.6231 |
| Purchases |
0.0000 |
0.0000 |
0.0000 |
0.0000 |
0.0000 |
0.0000 |
| Future Supplies |
0.0000 |
0.0000 |
0.0000 |
0.0000 |
0.0000 |
| Total Available Supply (MGD) |
7.6231 |
7.6231 |
7.6231 |
7.6231 |
7.6231 |
7.6231 |
| Service Area Demand |
3.7455 |
4.0951 |
4.7521 |
5.5165 |
6.4025 |
7.4203 |
| Sales |
0.0000 |
0.0000 |
0.0000 |
0.0000 |
0.0000 |
0.0000 |
| Future Sales |
0.0000 |
0.0000 |
0.0000 |
0.0000 |
0.0000 |
| Total Demand (MGD) |
3.7455 |
4.0951 |
4.7521 |
5.5165 |
6.4025 |
7.4203 |
| Demand as Percent of Supply |
49% |
54% |
62% |
72% |
84% |
97% |

The purpose of the above chart is to show a general indication of how the long-term per capita water demand changes over time. The per capita water demand may actually be different than indicated due to seasonal populations and the accuracy of data submitted. Water systems that have calculated long-term per capita water demand based on a methodology that produces different results may submit their information in the notes field.
Your long-term water demand is 53 gallons per capita per day. What demand management practices do you plan to implement to reduce the per capita water demand (i.e. conduct regular water audits, implement a plumbing retrofit program, employ practices such as rainwater harvesting or reclaimed water)? If these practices are covered elsewhere in your plan, indicate where the practices are discussed here.
No Changes
Are there other demand management practices you will implement to reduce your future supply needs? No Changes
What supplies other than the ones listed in future supplies are being considered to meet your future supply needs? None
How does the water system intend to implement the demand management and supply planning components above? N/A
Additional Information
Has this system participated in regional water supply or water use planning? No
What major water supply reports or studies were used for planning? None
Please describe any other needs or issues regarding your water supply sources, any water system deficiencies or needed improvements (storage, treatment, etc.) or your ability to meet present and future water needs. Include both quantity and quality considerations, as well as financial, technical, managerial, permitting, and compliance issues: None
The Division of Water Resources (DWR) provides the data contained within this
Local Water Supply Plan (LWSP) as a courtesy and service to our customers.
DWR staff does not field verify data. Neither DWR, nor any other party
involved in the preparation of this LWSP attests that the data is completely
free of errors and omissions. Furthermore, data users are cautioned that
LWSPs labeled PROVISIONAL have yet to be reviewed by DWR staff. Subsequent
review may result in significant revision. Questions regarding the accuracy
or limitations of usage of this data should be directed to the water system
and/or DWR.
|