|
The Division of Water Resources (DWR) provides the data contained within this
Local Water Supply Plan (LWSP) as a courtesy and service to our customers.
DWR staff does not field verify data. Neither DWR, nor any other party
involved in the preparation of this LWSP attests that the data is completely
free of errors and omissions. Furthermore, data users are cautioned that
LWSPs labeled PROVISIONAL have yet to be reviewed by DWR staff. Subsequent
review may result in significant revision. Questions regarding the accuracy
or limitations of usage of this data should be directed to the water system
and/or DWR.
1. System Information
Contact Information
Complete
| Water System Name: |
First Craven Sanitary District |
|
PWSID: |
04-25-040 |
| Mailing Address: | PO Box 608
Bridgeton, NC 28519 | Ownership: | District |
| |
| Contact Person: | Edward Riggs Jr. | Title: | Manager |
| Phone: | 252-633-6500 | Cell/Mobile: | 252-671-0457 |
Distribution System
| Line Type |
Size Range (Inches) |
Estimated % of lines |
| Ductile Iron |
4-10 |
4.00 % |
| Other |
2-10 |
4.00 % |
| Polyvinyl Chloride |
2-10 |
92.00 % |
Sewer Service is not provided by First Craven Sanitary District, sewer service is provided by the Town of Bridgeton (approximately 275 accounts) and the City of New Bern (approximately 120 accounts). All other accounts, except for 31 active accounts in 2024, were served by private individual septic systems. Examples of outdoor water use meters include irrigation meters and metered services to water animals. Programs
Water Conservation
First Craven Sanitary District has two emergency connections with Craven County Water System (NC 04-25-055). 2. Water Use Information
Service Area
| Sub-Basin(s) | % of Service Population |
|---|
| Neuse River (10-1) | 100 % |
|
| County(s) | % of Service Population |
|---|
| Craven | 100 % |
|
Water Use by Type
| Type of Use |
Metered
Connections |
Metered
Average Use (MGD) |
Non-Metered
Connections |
Non-Metered
Estimated Use (MGD) |
| Residential |
2,486 |
0.3370 |
0 |
0.0000 |
| Commercial |
117 |
0.0230 |
0 |
0.0000 |
| Industrial |
10 |
0.0110 |
0 |
0.0000 |
| Institutional |
25 |
0.0030 |
0 |
0.0000 |
How much water was used for system processes (backwash, line cleaning, flushing, etc.)? 0.0860 MGD
In 2024, the total groundwater pumped was 192.738 MG and the Water Treatment Plant produced 173.141 MG. In 2024, First Craven Sanitary District billed for 136.5746 MG.
System process water included 12.924 MG of backwash discharge, 1.25 MG used during the water treatment process, 7.95 MG of estimated storage tank overflow, and 9.24 MG of estimated flushing.
The metered water billed and system process water accounts for 87.1% of the water pumped. The 12.9% unaccountable water loss is due to leaks, slow or inaccurate meters, fire department use, line breaks, theft, and other uses Water Sales
| Purchaser |
PWSID |
Average
Daily Sold
(MGD) |
Days
Used |
Contract |
Required to
comply with water
use restrictions? |
Pipe Size(s)
(Inches) |
Use
Type |
| MGD |
Expiration |
Recurring |
| Craven County |
04-25-055 |
0.0000 |
0 |
0.0000 |
|
No |
No |
6 , 8 |
Emergency |
First Craven Sanitary District has two emergency connections with Craven County Water System. In 2024, these two connections were not used and no water was sold between the two systems. 3. Water Supply Sources
Monthly Withdrawals & Purchases
|
Average Daily
Use (MGD) |
Max Day
Use (MGD) |
|
Average Daily
Use (MGD) |
Max Day
Use (MGD) |
|
Average Daily
Use (MGD) |
Max Day
Use (MGD) |
| Jan |
0.4773 |
0.6620 |
May |
0.5454 |
0.7230 |
Sep |
0.5285 |
0.7090 |
| Feb |
0.5013 |
0.6710 |
Jun |
0.6865 |
0.8660 |
Oct |
0.5180 |
0.6830 |
| Mar |
0.5052 |
0.6560 |
Jul |
0.5450 |
0.7410 |
Nov |
0.4902 |
0.6730 |
| Apr |
0.5275 |
0.6420 |
Aug |
0.5344 |
0.7190 |
Dec |
0.4624 |
0.5850 |
The total withdrawal from the 3 wells in 2024 was 192.738 MG, or an average daily withdrawal of 0.527 MGD. 
Ground Water Sources
| Name or Number |
Average Daily Withdrawal (MGD) |
Max Day Withdrawal (MGD) |
12-Hour Supply
(MGD) |
CUA Reduction |
Year Offline |
Use Type |
| MGD |
Days Used |
| 1 |
0.2607 |
302 |
0.4950 |
0.5040 |
CUA0 |
|
Regular |
| 2 |
0.2113 |
138 |
0.4740 |
0.4320 |
CUA0 |
|
Regular |
| 3 |
0.2886 |
294 |
0.4630 |
0.5400 |
CUA0 |
|
Regular |
Ground Water Sources (continued)
| Name or Number |
Well Depth (Feet) |
Casing Depth
(Feet) |
Screen Depth (Feet) |
Well Diameter (Inches) |
Pump Intake Depth (Feet) |
Metered? |
| Top |
Bottom |
| 1 |
118 |
|
91 |
111 |
12 |
72 |
Yes |
| 2 |
118 |
|
91 |
111 |
12 |
61 |
Yes |
| 3 |
130 |
|
98 |
125 |
12 |
65 |
Yes |
Combined, the 3 wells have a 12-hour capacity of 1.476 MG. The 12-hour capacity of the water treatment plant to produce water is only 0.720 MG.
Due to water quality, the operation of well #2 has been reduced. Water Purchases From Other Systems
| Seller |
PWSID |
Average
Daily Purchased
(MGD) |
Days
Used |
Contract |
Required to
comply with water
use restrictions? |
Pipe Size(s)
(Inches) |
Use
Type |
| MGD |
Expiration |
Recurring |
| Craven County |
04-25-055 |
0.0000 |
0 |
|
|
No |
No |
6 , 8 |
Emergency |
Water Treatment Plants
| Plant Name |
Permitted Capacity
(MGD) |
Is Raw Water Metered? |
Is Finished Water Ouput Metered? |
Source |
| First Craven Sanitary District |
1.3680 |
Yes |
Yes |
3 groundwater wells in the Castle Hayne Aquifer |
4. Wastewater Information
Monthly Discharges
|
Average Daily
Discharge (MGD) |
|
Average Daily
Discharge (MGD) |
|
Average Daily
Discharge (MGD) |
| Jan |
0.0310 |
May |
0.0340 |
Sep |
0.0380 |
| Feb |
0.0320 |
Jun |
0.0450 |
Oct |
0.0350 |
| Mar |
0.0330 |
Jul |
0.0370 |
Nov |
0.0340 |
| Apr |
0.0360 |
Aug |
0.0390 |
Dec |
0.0320 |
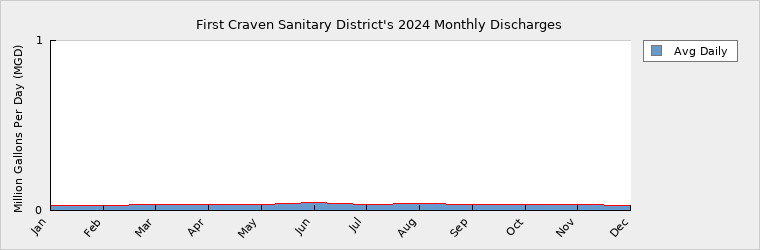
First Craven does not provide sewer service. Some customers on our system are provided public sewer service by the City of New Bern and the Town of Bridgeton. Most customers are on private septic systems. Wastewater Permits
| Permit Number |
Type |
Permitted Capacity
(MGD) |
Design Capacity
(MGD) |
Average Annual
Daily Discharge
(MGD) |
Maximum Day Discharge
(MGD) |
Receiving Stream |
Receiving Basin |
| NC0060321 |
WWTP |
0.1200 |
0.7200 |
0.0355 |
0.0840 |
Tributary to Duck Creek |
Neuse River (10-1) |
The NPDES permit allows backwash water to be discharged from the water treatment plant. 5. Planning
Projections
| |
2024 |
2030 |
2040 |
2050 |
2060 |
2070 |
| Year-Round Population |
6,360 |
6,700 |
7,510 |
8,260 |
9,010 |
9,760 |
| Seasonal Population |
0 |
0 |
0 |
0 |
0 |
0 |
| |
| Residential |
0.3370 |
0.3540 |
0.3970 |
0.4370 |
0.4770 |
0.5170 |
| Commercial |
0.0230 |
0.0240 |
0.0270 |
0.0300 |
0.0330 |
0.0350 |
| Industrial |
0.0110 |
0.0120 |
0.0130 |
0.0140 |
0.0160 |
0.0170 |
| Institutional |
0.0030 |
0.0030 |
0.0040 |
0.0040 |
0.0040 |
0.0050 |
| System Process |
0.0860 |
0.0900 |
0.1010 |
0.1120 |
0.1220 |
0.1320 |
| Unaccounted-for |
0.0666 |
0.0699 |
0.0785 |
0.0864 |
0.0944 |
0.1022 |
In 2024, the treatment capacity (in a 12 hour day) of the water plant was 0.720 MGD. In 2024, the water treatment plant produced on average 0.474 MGD with a peak day of 0.790 MG. Future Supply Sources
| Source Name |
PWSID |
Source Type |
Additional Supply |
Year Online |
Year Offline |
Type |
| Addition of 2 wells and WTP upgrades |
04-25-040 |
Ground |
0.5000 |
2030 |
|
Regular |
It is estimated that additional wells and a water treatment plant upgrade, or a second treatment plant, will be needed around 2030 to supply water to the service area of the District. This upgrade is predicted to supply the District's water needs beyond 2040. Demand v/s Percent of Supply
| |
2024 |
2030 |
2040 |
2050 |
2060 |
2070 |
| Surface Water Supply |
0.0000 |
0.0000 |
0.0000 |
0.0000 |
0.0000 |
0.0000 |
| Ground Water Supply |
1.4760 |
1.4760 |
1.4760 |
1.4760 |
1.4760 |
1.4760 |
| Purchases |
0.0000 |
0.0000 |
0.0000 |
0.0000 |
0.0000 |
0.0000 |
| Future Supplies |
0.5000 |
0.5000 |
0.5000 |
0.5000 |
0.5000 |
| Total Available Supply (MGD) |
1.4760 |
1.9760 |
1.9760 |
1.9760 |
1.9760 |
1.9760 |
| Service Area Demand |
0.5266 |
0.5529 |
0.6205 |
0.6834 |
0.7464 |
0.8082 |
| Sales |
0.0000 |
0.0000 |
0.0000 |
0.0000 |
0.0000 |
0.0000 |
| Future Sales |
0.0000 |
0.0000 |
0.0000 |
0.0000 |
0.0000 |
| Total Demand (MGD) |
0.5266 |
0.5529 |
0.6205 |
0.6834 |
0.7464 |
0.8082 |
| Demand as Percent of Supply |
36% |
28% |
31% |
35% |
38% |
41% |

The purpose of the above chart is to show a general indication of how the long-term per capita water demand changes over time. The per capita water demand may actually be different than indicated due to seasonal populations and the accuracy of data submitted. Water systems that have calculated long-term per capita water demand based on a methodology that produces different results may submit their information in the notes field.
Your long-term water demand is 53 gallons per capita per day. What demand management practices do you plan to implement to reduce the per capita water demand (i.e. conduct regular water audits, implement a plumbing retrofit program, employ practices such as rainwater harvesting or reclaimed water)? If these practices are covered elsewhere in your plan, indicate where the practices are discussed here.
Are there other demand management practices you will implement to reduce your future supply needs?
What supplies other than the ones listed in future supplies are being considered to meet your future supply needs?
How does the water system intend to implement the demand management and supply planning components above?
Additional Information
Has this system participated in regional water supply or water use planning? No
What major water supply reports or studies were used for planning?
Please describe any other needs or issues regarding your water supply sources, any water system deficiencies or needed improvements (storage, treatment, etc.) or your ability to meet present and future water needs. Include both quantity and quality considerations, as well as financial, technical, managerial, permitting, and compliance issues: The Water Treatment Plant has a capacity (for a 12 hour day) of 0.720 MGD. As average demand approaches this point, future upgrades and additions to the Water Treatment Plant will be needed.
The Division of Water Resources (DWR) provides the data contained within this
Local Water Supply Plan (LWSP) as a courtesy and service to our customers.
DWR staff does not field verify data. Neither DWR, nor any other party
involved in the preparation of this LWSP attests that the data is completely
free of errors and omissions. Furthermore, data users are cautioned that
LWSPs labeled PROVISIONAL have yet to be reviewed by DWR staff. Subsequent
review may result in significant revision. Questions regarding the accuracy
or limitations of usage of this data should be directed to the water system
and/or DWR.
|