|
The Division of Water Resources (DWR) provides the data contained within this
Local Water Supply Plan (LWSP) as a courtesy and service to our customers.
DWR staff does not field verify data. Neither DWR, nor any other party
involved in the preparation of this LWSP attests that the data is completely
free of errors and omissions. Furthermore, data users are cautioned that
LWSPs labeled PROVISIONAL have yet to be reviewed by DWR staff. Subsequent
review may result in significant revision. Questions regarding the accuracy
or limitations of usage of this data should be directed to the water system
and/or DWR.
1. System Information
Contact Information
Complete
| Water System Name: |
Dare Co Regional |
|
PWSID: |
04-28-030 |
| Mailing Address: | 600 Mustian Street
Kill Devil Hills, NC 27948 | Ownership: | County |
| |
| Contact Person: | Robert Wernock | Title: | Dare County Regional Superintendent |
| Phone: | 252-475-5808 | Cell/Mobile: | -- |
| |
| Secondary Contact: | Jessica King | | Phone: | 252-475-5606 |
| Mailing Address: | 600 Mustian Street
Kill Devil Hills, NC 27948 | Cell/Mobile: | -- |
Distribution System
| Line Type |
Size Range (Inches) |
Estimated % of lines |
| Asbestos Cement |
6-16 |
2.00 % |
| Ductile Iron |
6-24 |
4.00 % |
| Polyvinyl Chloride |
2-24 |
94.00 % |
Programs
Water Conservation
2. Water Use Information
Service Area
| Sub-Basin(s) | % of Service Population |
|---|
| Albemarle Sound (12-1) | 0 % |
|
| County(s) | % of Service Population |
|---|
| Dare | 0 % |
|
Water Use by Type
| Type of Use |
Metered
Connections |
Metered
Average Use (MGD) |
Non-Metered
Connections |
Non-Metered
Estimated Use (MGD) |
| Residential |
8,690 |
1.4750 |
0 |
0.0000 |
| Commercial |
455 |
0.4050 |
0 |
0.0000 |
| Industrial |
0 |
0.0000 |
0 |
0.0000 |
| Institutional |
0 |
0.0000 |
0 |
0.0000 |
How much water was used for system processes (backwash, line cleaning, flushing, etc.)? 0.7460 MGD
Water Sales
| Purchaser |
PWSID |
Average
Daily Sold
(MGD) |
Days
Used |
Contract |
Required to
comply with water
use restrictions? |
Pipe Size(s)
(Inches) |
Use
Type |
| MGD |
Expiration |
Recurring |
| Kill Devil Hills |
04-28-015 |
1.1660 |
365 |
3.0000 |
2036 |
|
|
12-24 |
Regular |
| Manteo |
04-28-020 |
0.2520 |
365 |
0.7000 |
|
|
|
12-24 |
Regular |
| Nags Head |
04-28-010 |
1.1470 |
365 |
3.5000 |
2036 |
|
|
12-24 |
Regular |
3. Water Supply Sources
Monthly Withdrawals & Purchases
|
Average Daily
Use (MGD) |
Max Day
Use (MGD) |
|
Average Daily
Use (MGD) |
Max Day
Use (MGD) |
|
Average Daily
Use (MGD) |
Max Day
Use (MGD) |
| Jan |
3.2580 |
5.2080 |
May |
5.8280 |
8.1460 |
Sep |
5.6810 |
7.8550 |
| Feb |
3.4680 |
4.6340 |
Jun |
7.9640 |
9.3380 |
Oct |
4.7810 |
7.4780 |
| Mar |
3.7190 |
5.4550 |
Jul |
8.7700 |
9.9730 |
Nov |
4.4340 |
7.0460 |
| Apr |
4.3770 |
5.7790 |
Aug |
8.4920 |
9.8410 |
Dec |
3.5860 |
7.1140 |

Ground Water Sources
| Name or Number |
Average Daily Withdrawal (MGD) |
Max Day Withdrawal (MGD) |
12-Hour Supply
(MGD) |
CUA Reduction |
Year Offline |
Use Type |
| MGD |
Days Used |
| NRO Well 10 |
0.7170 |
166 |
0.720 |
0.7200 |
|
|
Regular |
| NRO Well 8 |
0.4730 |
246 |
0.648 |
0.6480 |
|
|
Regular |
| NRO Well 9 |
0.7450 |
181 |
0.792 |
0.7920 |
|
|
Regular |
| NRO Well1 |
0.6050 |
172 |
0.648 |
0.6480 |
|
|
Regular |
| NRO Well2 |
0.5880 |
133 |
0.648 |
0.6480 |
|
|
Regular |
| NRO Well3 |
0.4870 |
200 |
0.648 |
0.6480 |
|
|
Regular |
| NRO Well4 |
0.5500 |
191 |
0.648 |
0.6480 |
|
|
Regular |
| NRO Well5 |
0.4490 |
147 |
0.648 |
0.6480 |
|
|
Regular |
| NRO Well6 |
0.4980 |
110 |
0.648 |
0.6480 |
|
|
Regular |
| NRO Well7 |
0.5340 |
166 |
0.648 |
0.6480 |
|
|
Regular |
| S-1 |
0.3800 |
71 |
0.771 |
0.7710 |
|
2002 |
Regular |
| S-10 |
0.4180 |
350 |
0.732 |
0.7320 |
|
|
Regular |
| S-11 |
0.3110 |
351 |
0.696 |
0.6960 |
|
|
Regular |
| S-12 |
0.0400 |
12 |
0.682 |
0.6820 |
|
|
Regular |
| S-13 |
0.3730 |
328 |
0.634 |
0.6340 |
|
|
Regular |
| S-4 |
0.3750 |
330 |
0.717 |
0.7170 |
|
|
Regular |
| S-5 |
0.3340 |
331 |
0.946 |
0.9460 |
|
|
Regular |
| S-7 |
0.2790 |
351 |
0.995 |
0.9950 |
|
|
Regular |
| S-8 |
0.6760 |
334 |
0.780 |
0.7800 |
|
|
Regular |
| S-9 |
0.4520 |
352 |
0.932 |
0.9320 |
|
|
Regular |
Ground Water Sources (continued)
| Name or Number |
Well Depth (Feet) |
Casing Depth
(Feet) |
Screen Depth (Feet) |
Well Diameter (Inches) |
Pump Intake Depth (Feet) |
Metered? |
| Top |
Bottom |
| NRO Well 10 |
402 |
302 |
302 |
402 |
8 |
80 |
Yes |
| NRO Well 8 |
425 |
325 |
325 |
425 |
8 |
80 |
Yes |
| NRO Well 9 |
410 |
310 |
310 |
410 |
8 |
80 |
Yes |
| NRO Well1 |
425 |
325 |
325 |
425 |
8 |
80 |
Yes |
| NRO Well2 |
425 |
325 |
325 |
425 |
8 |
80 |
Yes |
| NRO Well3 |
425 |
325 |
325 |
425 |
8 |
80 |
Yes |
| NRO Well4 |
425 |
325 |
325 |
425 |
8 |
80 |
Yes |
| NRO Well5 |
425 |
325 |
325 |
425 |
8 |
80 |
Yes |
| NRO Well6 |
425 |
325 |
325 |
425 |
8 |
80 |
Yes |
| NRO Well7 |
425 |
325 |
325 |
425 |
8 |
80 |
Yes |
| S-1 |
236 |
132 |
132 |
220 |
8 |
91 |
Yes |
| S-10 |
250 |
141 |
141 |
192 |
8 |
100 |
Yes |
| S-11 |
223 |
187 |
187 |
218 |
8 |
80 |
Yes |
| S-12 |
244 |
140 |
140 |
190 |
8 |
80 |
Yes |
| S-13 |
225 |
176 |
176 |
216 |
8 |
80 |
Yes |
| S-4 |
250 |
170 |
170 |
220 |
8 |
100 |
Yes |
| S-5 |
235 |
168 |
168 |
218 |
8 |
100 |
Yes |
| S-7 |
250 |
165 |
165 |
215 |
8 |
100 |
Yes |
| S-8 |
250 |
162 |
162 |
212 |
8 |
100 |
Yes |
| S-9 |
200 |
120 |
120 |
190 |
8 |
100 |
Yes |
Water Purchases From Other Systems
| Seller |
PWSID |
Average
Daily Purchased
(MGD) |
Days
Used |
Contract |
Required to
comply with water
use restrictions? |
Pipe Size(s)
(Inches) |
Use
Type |
| MGD |
Expiration |
Recurring |
| Kill Devil Hills |
04-28-015 |
0.0000 |
0 |
0.0000 |
|
|
|
12-24 |
Emergency |
| Nags Head |
04-28-010 |
0.5290 |
51 |
1.5000 |
2036 |
|
|
12 |
Regular |
Water Treatment Plants
| Plant Name |
Permitted Capacity
(MGD) |
Is Raw Water Metered? |
Is Finished Water Ouput Metered? |
Source |
| Dare Co NRO |
3.0000 |
Yes |
Yes |
Mid Yorktown Aquifer |
| Skyco Water Plant |
5.0000 |
Yes |
Yes |
Upper Yorktown Aquifer |
4. Wastewater Information
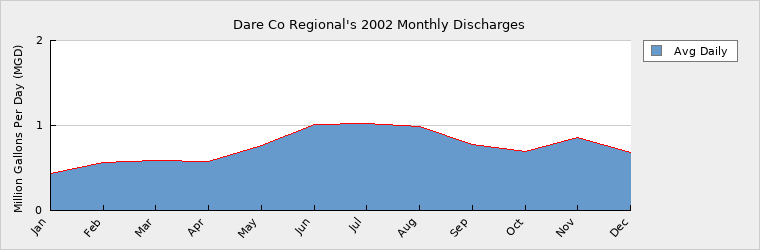
Monthly Discharges
|
Average Daily
Discharge (MGD) |
|
Average Daily
Discharge (MGD) |
|
Average Daily
Discharge (MGD) |
| Jan |
0.4360 |
May |
0.7620 |
Sep |
0.7730 |
| Feb |
0.5700 |
Jun |
1.0060 |
Oct |
0.6970 |
| Mar |
0.5840 |
Jul |
1.0230 |
Nov |
0.8530 |
| Apr |
0.5780 |
Aug |
0.9930 |
Dec |
0.6790 |
Wastewater Permits
| Permit Number |
Type |
Permitted Capacity
(MGD) |
Design Capacity
(MGD) |
Average Annual
Daily Discharge
(MGD) |
Maximum Day Discharge
(MGD) |
Receiving Stream |
Receiving Basin |
| NC0035670 |
|
0.0620 |
0.0000 |
0.0430 |
0.0590 |
Unnamed Tributary |
Albemarle Sound (12-1) |
NPDES permit NC0070157 dischrages into the Atlantic Ocean. 5. Planning
Projections
| |
2002 |
2010 |
2020 |
2030 |
| Year-Round Population |
15,490 |
17,000 |
21,000 |
25,000 |
| Seasonal Population |
150,000 |
170,000 |
210,000 |
250,000 |
| |
| Residential |
1.4750 |
4.3750 |
5.4040 |
6.4340 |
| Commercial |
0.4050 |
1.2010 |
1.4840 |
1.7670 |
| Industrial |
0.0000 |
0.0000 |
0.0000 |
0.0000 |
| Institutional |
0.0000 |
0.0000 |
0.0000 |
0.0000 |
| System Process |
0.7460 |
2.2130 |
2.7330 |
3.2540 |
| Unaccounted-for |
0.6000 |
1.7410 |
2.1510 |
2.5600 |
Demand projections (2010-2030) based on peak usage for summer months of June, July, and August (8.409 mgd) and the seasonal population provided. Future Supply Sources
| Source Name |
PWSID |
Source Type |
Additional Supply |
Year Online |
Year Offline |
Type |
| 4 new wells at NRO |
04-28-030 |
Ground |
2.5920 |
2004 |
|
Regular |
As stated by Dare Co Regional, in the event that the system is producing ninety percent of its capacity on two consecutive days in the previous twelve months or if a purchase system exceeds their allocated amount of water on two consecutive days in the previous twelve month period, Dare Co Regional shall immediately begin work to expand the production system, in not less than one million gallon per day increments. Demand v/s Percent of Supply
| |
2002 |
2010 |
2020 |
2030 |
| Surface Water Supply |
0.0000 |
0.0000 |
0.0000 |
0.0000 |
| Ground Water Supply |
14.5810 |
13.8100 |
13.8100 |
13.8100 |
| Purchases |
1.5000 |
1.5000 |
1.5000 |
1.5000 |
| Future Supplies |
2.5920 |
2.5920 |
2.5920 |
| Total Available Supply (MGD) |
16.0810 |
17.9020 |
17.9020 |
17.9020 |
| Service Area Demand |
3.2260 |
9.5300 |
11.7720 |
14.0150 |
| Sales |
2.5650 |
7.2000 |
7.2000 |
7.2000 |
| Future Sales |
0.0000 |
0.0000 |
0.0000 |
| Total Demand (MGD) |
5.7910 |
16.7300 |
18.9720 |
21.2150 |
| Demand as Percent of Supply |
36% |
93% |
106% |
119% |

The purpose of the above chart is to show a general indication of how the long-term per capita water demand changes over time. The per capita water demand may actually be different than indicated due to seasonal populations and the accuracy of data submitted. Water systems that have calculated long-term per capita water demand based on a methodology that produces different results may submit their information in the notes field.
Your long-term water demand is 95 gallons per capita per day. What demand management practices do you plan to implement to reduce the per capita water demand (i.e. conduct regular water audits, implement a plumbing retrofit program, employ practices such as rainwater harvesting or reclaimed water)? If these practices are covered elsewhere in your plan, indicate where the practices are discussed here.
Are there other demand management practices you will implement to reduce your future supply needs?
What supplies other than the ones listed in future supplies are being considered to meet your future supply needs?
How does the water system intend to implement the demand management and supply planning components above?
Demand projections (2010-2030) based on peak usage for summer months of June, July, and August (8.409 mgd) and the seasonal population provided. As stated by Dare Co Regional, in the event that the system is producing ninety percent of its capacity on two consecutive days in the previous twelve months or if a purchase system exceeds their allocated amount of water on two consecutive days in the previous twelve month period, Dare Co Regional shall immediately begin work to expand the production system, in not less than one million gallon per day increments. Additional Information
Has this system participated in regional water supply or water use planning? Yes
What major water supply reports or studies were used for planning? Additional historical materials were included with the submission of the LWSP and is available in the files.
Please describe any other needs or issues regarding your water supply sources, any water system deficiencies or needed improvements (storage, treatment, etc.) or your ability to meet present and future water needs. Include both quantity and quality considerations, as well as financial, technical, managerial, permitting, and compliance issues: NRO has applied for a permit from the State to expand production capacity from 3MGD to 5 MGD.
Skyco completed it's anion exchange improvements in 2002 and has a 3MG reserve in the Capital Improvement Plan for 2004-05.
The Division of Water Resources (DWR) provides the data contained within this
Local Water Supply Plan (LWSP) as a courtesy and service to our customers.
DWR staff does not field verify data. Neither DWR, nor any other party
involved in the preparation of this LWSP attests that the data is completely
free of errors and omissions. Furthermore, data users are cautioned that
LWSPs labeled PROVISIONAL have yet to be reviewed by DWR staff. Subsequent
review may result in significant revision. Questions regarding the accuracy
or limitations of usage of this data should be directed to the water system
and/or DWR.
|