|
The Division of Water Resources (DWR) provides the data contained within this
Local Water Supply Plan (LWSP) as a courtesy and service to our customers.
DWR staff does not field verify data. Neither DWR, nor any other party
involved in the preparation of this LWSP attests that the data is completely
free of errors and omissions. Furthermore, data users are cautioned that
LWSPs labeled PROVISIONAL have yet to be reviewed by DWR staff. Subsequent
review may result in significant revision. Questions regarding the accuracy
or limitations of usage of this data should be directed to the water system
and/or DWR.
1. System Information
Contact Information
Complete
| Water System Name: |
Magnolia |
|
PWSID: |
04-31-035 |
| Mailing Address: | P.O. Box 459
Magnolia, NC 28453 | Ownership: | Municipality |
| |
| Contact Person: | Sudie Matthis/Dawn Ward | Title: | ORC-Mayor |
| Phone: | 910-284-6557 | Cell/Mobile: | -- |
Distribution System
| Line Type |
Size Range (Inches) |
Estimated % of lines |
| Asbestos Cement |
6-8 |
6.00 % |
| Galvanized Iron |
2 |
4.50 % |
| Polyvinyl Chloride |
2-8 |
89.50 % |
Programs
Water Conservation
2. Water Use Information
Service Area
| Sub-Basin(s) | % of Service Population |
|---|
| Northeast Cape Fear River (02-5) | 100 % |
|
| County(s) | % of Service Population |
|---|
| Duplin | 100 % |
|
Water Use by Type
| Type of Use |
Metered
Connections |
Metered
Average Use (MGD) |
Non-Metered
Connections |
Non-Metered
Estimated Use (MGD) |
| Residential |
362 |
0.0420 |
0 |
0.0000 |
| Commercial |
13 |
0.0040 |
0 |
0.0000 |
| Industrial |
0 |
0.0000 |
0 |
0.0000 |
| Institutional |
6 |
0.0030 |
8 |
0.0050 |
How much water was used for system processes (backwash, line cleaning, flushing, etc.)? 0.0060 MGD
3. Water Supply Sources
Monthly Withdrawals & Purchases
|
Average Daily
Use (MGD) |
Max Day
Use (MGD) |
|
Average Daily
Use (MGD) |
Max Day
Use (MGD) |
|
Average Daily
Use (MGD) |
Max Day
Use (MGD) |
| Jan |
0.0670 |
0.0870 |
May |
0.0630 |
0.1360 |
Sep |
0.0660 |
0.1100 |
| Feb |
0.0640 |
0.1010 |
Jun |
0.0760 |
0.1120 |
Oct |
0.0670 |
0.0730 |
| Mar |
0.0630 |
0.0960 |
Jul |
0.0650 |
0.0840 |
Nov |
0.0710 |
0.0870 |
| Apr |
0.0640 |
0.0880 |
Aug |
0.0650 |
0.0770 |
Dec |
0.0750 |
0.1050 |

Ground Water Sources
| Name or Number |
Average Daily Withdrawal (MGD) |
Max Day Withdrawal (MGD) |
12-Hour Supply
(MGD) |
CUA Reduction |
Year Offline |
Use Type |
| MGD |
Days Used |
| 101 |
0.0000 |
0 |
0 |
0.1575 |
CUA0 |
|
Emergency |
| 101,102 |
0.0000 |
0 |
0 |
0.0000 |
CUA0 |
|
Regular |
| 102 |
0.0670 |
366 |
0.136 |
0.1050 |
CUA0 |
|
Regular |
Ground Water Sources (continued)
| Name or Number |
Well Depth (Feet) |
Casing Depth
(Feet) |
Screen Depth (Feet) |
Well Diameter (Inches) |
Pump Intake Depth (Feet) |
Metered? |
| Top |
Bottom |
| 101 |
330 |
|
129 |
222 |
8 |
174 |
Yes |
| 101,102 |
|
|
|
|
|
|
Yes |
| 102 |
200 |
|
170 |
200 |
6 |
90 |
Yes |
Well #1 was recovered in Dec 2024 and passed the bacteriological on January 14 2025. At this date ,the depth of screen top and bottom
is not forwarded. The request has been made, but unable to obtain by today. Water Purchases From Other Systems
| Seller |
PWSID |
Average
Daily Purchased
(MGD) |
Days
Used |
Contract |
Required to
comply with water
use restrictions? |
Pipe Size(s)
(Inches) |
Use
Type |
| MGD |
Expiration |
Recurring |
| Duplin County System |
04-31-085 |
0.0000 |
0 |
0.0000 |
2024 |
No |
No |
8 |
Emergency |
Water Treatment Plants
| Plant Name |
Permitted Capacity
(MGD) |
Is Raw Water Metered? |
Is Finished Water Ouput Metered? |
Source |
| Magnolia |
0.2700 |
Yes |
Yes |
Well 1 & 2 |
4. Wastewater Information
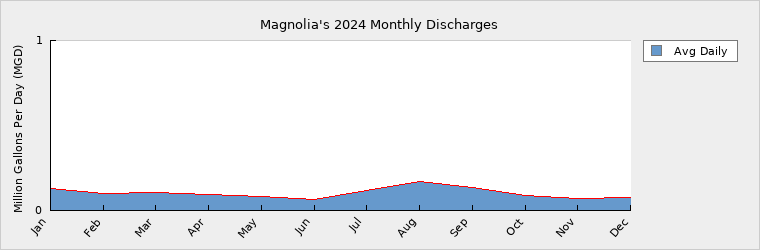
Monthly Discharges
|
Average Daily
Discharge (MGD) |
|
Average Daily
Discharge (MGD) |
|
Average Daily
Discharge (MGD) |
| Jan |
0.1310 |
May |
0.0820 |
Sep |
0.1360 |
| Feb |
0.1020 |
Jun |
0.0650 |
Oct |
0.0870 |
| Mar |
0.1060 |
Jul |
0.1150 |
Nov |
0.0730 |
| Apr |
0.0930 |
Aug |
0.1710 |
Dec |
0.0770 |
Wastewater Permits
| Permit Number |
Type |
Permitted Capacity
(MGD) |
Design Capacity
(MGD) |
Average Annual
Daily Discharge
(MGD) |
Maximum Day Discharge
(MGD) |
Receiving Stream |
Receiving Basin |
| NC0020346 |
WWTP |
0.2500 |
0.2500 |
0.1030 |
0.3160 |
Stwerts Creek |
Northeast Cape Fear River (02-5) |
Wastewater Interconnections
| Water System |
PWSID |
Type |
Average Daily Amount |
Contract
Maximum (MGD) |
| MGD |
Days Used |
| Duplin County |
04-31-085 |
Receiving |
0.0043 |
366 |
0.0300 |
5. Planning
Projections
| |
2024 |
2030 |
2040 |
2050 |
2060 |
2070 |
| Year-Round Population |
980 |
1,000 |
1,020 |
1,040 |
1,061 |
1,082 |
| Seasonal Population |
0 |
0 |
0 |
0 |
0 |
0 |
| |
| Residential |
0.0420 |
0.0430 |
0.0439 |
0.0447 |
0.0456 |
0.0465 |
| Commercial |
0.0040 |
0.0040 |
0.0041 |
0.0041 |
0.0041 |
0.0042 |
| Industrial |
0.0000 |
0.0000 |
0.0000 |
0.0000 |
0.0000 |
0.0000 |
| Institutional |
0.0080 |
0.0085 |
0.0094 |
0.0104 |
0.0114 |
0.0126 |
| System Process |
0.0060 |
0.0060 |
0.0061 |
0.0062 |
0.0062 |
0.0063 |
| Unaccounted-for |
0.0070 |
0.0076 |
0.0078 |
0.0081 |
0.0083 |
0.0086 |
Future Supply Sources
| Source Name |
PWSID |
Source Type |
Additional Supply |
Year Online |
Year Offline |
Type |
| Town of Magnolia |
04-31-035 |
Ground |
0.2700 |
2028 |
|
Regular |
the Town received a grant to drill new well in March of this year. This new well is to replace well Well #1 which has been recovered 2 times since
2006. Demand v/s Percent of Supply
| |
2024 |
2030 |
2040 |
2050 |
2060 |
2070 |
| Surface Water Supply |
0.0000 |
0.0000 |
0.0000 |
0.0000 |
0.0000 |
0.0000 |
| Ground Water Supply |
0.2700 |
0.2700 |
0.2700 |
0.2700 |
0.2700 |
0.2700 |
| Purchases |
0.0000 |
0.0000 |
0.0000 |
0.0000 |
0.0000 |
0.0000 |
| Future Supplies |
0.2700 |
0.2700 |
0.2700 |
0.2700 |
0.2700 |
| Total Available Supply (MGD) |
0.2700 |
0.5400 |
0.5400 |
0.5400 |
0.5400 |
0.5400 |
| Service Area Demand |
0.0670 |
0.0691 |
0.0713 |
0.0735 |
0.0756 |
0.0782 |
| Sales |
0.0000 |
0.0000 |
0.0000 |
0.0000 |
0.0000 |
0.0000 |
| Future Sales |
0.0000 |
0.0000 |
0.0000 |
0.0000 |
0.0000 |
| Total Demand (MGD) |
0.0670 |
0.0691 |
0.0713 |
0.0735 |
0.0756 |
0.0782 |
| Demand as Percent of Supply |
25% |
13% |
13% |
14% |
14% |
14% |

The purpose of the above chart is to show a general indication of how the long-term per capita water demand changes over time. The per capita water demand may actually be different than indicated due to seasonal populations and the accuracy of data submitted. Water systems that have calculated long-term per capita water demand based on a methodology that produces different results may submit their information in the notes field.
Your long-term water demand is 43 gallons per capita per day. What demand management practices do you plan to implement to reduce the per capita water demand (i.e. conduct regular water audits, implement a plumbing retrofit program, employ practices such as rainwater harvesting or reclaimed water)? If these practices are covered elsewhere in your plan, indicate where the practices are discussed here.
Are there other demand management practices you will implement to reduce your future supply needs?
What supplies other than the ones listed in future supplies are being considered to meet your future supply needs?
How does the water system intend to implement the demand management and supply planning components above?
The current permitted groundwater supply for Magnolia is 0.27 MGD. Since Well No. 101 was recovered at the end of 2024, the actual 12-hr supply is only 0.105 MGD. Additional Information
Has this system participated in regional water supply or water use planning? No
What major water supply reports or studies were used for planning? Consumption Report Well withdraws, Pumped finished water, waste water DMR
Please describe any other needs or issues regarding your water supply sources, any water system deficiencies or needed improvements (storage, treatment, etc.) or your ability to meet present and future water needs. Include both quantity and quality considerations, as well as financial, technical, managerial, permitting, and compliance issues: The Town will pursue grant funding for replacement of inoperable valves within the system. Also, the replacement of old fire hydrants with new ones
with pressure data logger system on all end line hydrants, and other selective hydrants. Seek the feasibility of ways to give better fire fighting capability.
The Division of Water Resources (DWR) provides the data contained within this
Local Water Supply Plan (LWSP) as a courtesy and service to our customers.
DWR staff does not field verify data. Neither DWR, nor any other party
involved in the preparation of this LWSP attests that the data is completely
free of errors and omissions. Furthermore, data users are cautioned that
LWSPs labeled PROVISIONAL have yet to be reviewed by DWR staff. Subsequent
review may result in significant revision. Questions regarding the accuracy
or limitations of usage of this data should be directed to the water system
and/or DWR.
|