|
The Division of Water Resources (DWR) provides the data contained within this
Local Water Supply Plan (LWSP) as a courtesy and service to our customers.
DWR staff does not field verify data. Neither DWR, nor any other party
involved in the preparation of this LWSP attests that the data is completely
free of errors and omissions. Furthermore, data users are cautioned that
LWSPs labeled PROVISIONAL have yet to be reviewed by DWR staff. Subsequent
review may result in significant revision. Questions regarding the accuracy
or limitations of usage of this data should be directed to the water system
and/or DWR.
1. System Information
Contact Information
Provisional
| Water System Name: |
Teachey |
|
PWSID: |
04-31-044 |
| Mailing Address: | P.O. Box 145
Teachey, NC 28464 | Ownership: | Municipality |
| |
| Contact Person: | James C Parker Jr | Title: | Public Works Director |
| Phone: | 910-284-3149 | Cell/Mobile: | -- |
| |
| Secondary Contact: | Mike Houston | | Phone: | 919-812-6088 |
| Mailing Address: |
, NC | Cell/Mobile: | -- |
Distribution System
| Line Type |
Size Range (Inches) |
Estimated % of lines |
| Polyvinyl Chloride |
2-12 |
100.00 % |
Programs
As employees ride throughout the system they are looking for leaks and utilize NCRWA on an as needed basis. Water Conservation
2. Water Use Information
Service Area
| Sub-Basin(s) | % of Service Population |
|---|
| Northeast Cape Fear River (02-5) | 100 % |
|
| County(s) | % of Service Population |
|---|
| Duplin | 100 % |
|
Water Use by Type
| Type of Use |
Metered
Connections |
Metered
Average Use (MGD) |
Non-Metered
Connections |
Non-Metered
Estimated Use (MGD) |
| Residential |
247 |
0.0333 |
0 |
0.0000 |
| Commercial |
0 |
0.0000 |
0 |
0.0000 |
| Industrial |
0 |
0.0000 |
0 |
0.0000 |
| Institutional |
0 |
0.0000 |
3 |
0.0001 |
How much water was used for system processes (backwash, line cleaning, flushing, etc.)? 0.0014 MGD
Although our unaccounted-for water % has decreased since 2023, we are still actively looking for leaks in the system to lower our overall water loss. 3. Water Supply Sources
Monthly Withdrawals & Purchases
|
Average Daily
Use (MGD) |
Max Day
Use (MGD) |
|
Average Daily
Use (MGD) |
Max Day
Use (MGD) |
|
Average Daily
Use (MGD) |
Max Day
Use (MGD) |
| Jan |
0.0428 |
|
May |
0.0462 |
|
Sep |
0.0481 |
|
| Feb |
0.0405 |
|
Jun |
0.0541 |
|
Oct |
0.0413 |
|
| Mar |
0.0417 |
|
Jul |
0.0471 |
|
Nov |
0.0398 |
|
| Apr |
0.0425 |
|
Aug |
0.0532 |
|
Dec |
0.0463 |
|

Water Purchases From Other Systems
| Seller |
PWSID |
Average
Daily Purchased
(MGD) |
Days
Used |
Contract |
Required to
comply with water
use restrictions? |
Pipe Size(s)
(Inches) |
Use
Type |
| MGD |
Expiration |
Recurring |
| Wallace |
04-31-010 |
0.0453 |
366 |
0.1000 |
2034 |
Yes |
Yes |
12 |
Regular |
4. Wastewater Information
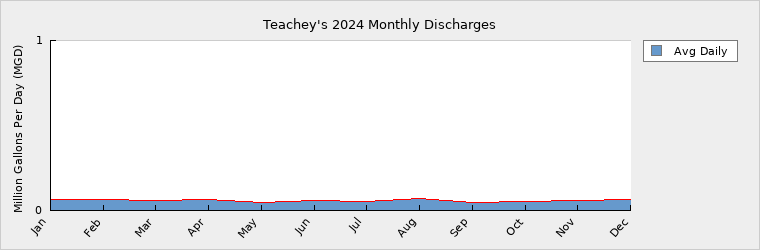
Monthly Discharges
|
Average Daily
Discharge (MGD) |
|
Average Daily
Discharge (MGD) |
|
Average Daily
Discharge (MGD) |
| Jan |
0.0664 |
May |
0.0485 |
Sep |
0.0494 |
| Feb |
0.0649 |
Jun |
0.0584 |
Oct |
0.0554 |
| Mar |
0.0575 |
Jul |
0.0543 |
Nov |
0.0572 |
| Apr |
0.0673 |
Aug |
0.0677 |
Dec |
0.0626 |
Wastewater Interconnections
| Water System |
PWSID |
Type |
Average Daily Amount |
Contract
Maximum (MGD) |
| MGD |
Days Used |
| Wallace |
04-31-010 |
Discharging |
0.0591 |
366 |
0.1000 |
5. Planning
Projections
| |
2024 |
2030 |
2040 |
2050 |
2060 |
2070 |
| Year-Round Population |
663 |
693 |
747 |
799 |
855 |
914 |
| Seasonal Population |
0 |
0 |
0 |
0 |
0 |
0 |
| |
| Residential |
0.0333 |
0.0348 |
0.0374 |
0.0400 |
0.0427 |
0.0456 |
| Commercial |
0.0000 |
0.0000 |
0.0000 |
0.0000 |
0.0000 |
0.0000 |
| Industrial |
0.0000 |
0.0000 |
0.0000 |
0.0000 |
0.0000 |
0.0000 |
| Institutional |
0.0001 |
0.0001 |
0.0001 |
0.0001 |
0.0001 |
0.0001 |
| System Process |
0.0014 |
0.0014 |
0.0015 |
0.0016 |
0.0017 |
0.0018 |
| Unaccounted-for |
0.0105 |
0.0110 |
0.0118 |
0.0126 |
0.0134 |
0.0143 |
We are still awaiting the details of this development project. The information below is an estimate only, if the project moves forward.
The Town of Teachey will be experiencing a large increase in growth in the next 3-5 years, due to a new subdivision development. This development consists of 203 new homes with an estimated 3.5 persons per home. If this project meets the expectations, we could see an additional 650-700 customers within the next 5-10 years. We anticipate growth to settle after this project with average growth to follow thereafter. Future Supply Sources
| Source Name |
PWSID |
Source Type |
Additional Supply |
Year Online |
Year Offline |
Type |
| Town of Wallace |
04-31-010 |
Purchase |
0.0500 |
2030 |
|
Regular |
Demand v/s Percent of Supply
| |
2024 |
2030 |
2040 |
2050 |
2060 |
2070 |
| Surface Water Supply |
0.0000 |
0.0000 |
0.0000 |
0.0000 |
0.0000 |
0.0000 |
| Ground Water Supply |
0.0000 |
0.0000 |
0.0000 |
0.0000 |
0.0000 |
0.0000 |
| Purchases |
0.1000 |
0.1000 |
0.1000 |
0.1000 |
0.1000 |
0.1000 |
| Future Supplies |
0.0500 |
0.0500 |
0.0500 |
0.0500 |
0.0500 |
| Total Available Supply (MGD) |
0.1000 |
0.1500 |
0.1500 |
0.1500 |
0.1500 |
0.1500 |
| Service Area Demand |
0.0453 |
0.0473 |
0.0508 |
0.0543 |
0.0579 |
0.0618 |
| Sales |
0.0000 |
0.0000 |
0.0000 |
0.0000 |
0.0000 |
0.0000 |
| Future Sales |
0.0000 |
0.0000 |
0.0000 |
0.0000 |
0.0000 |
| Total Demand (MGD) |
0.0453 |
0.0473 |
0.0508 |
0.0543 |
0.0579 |
0.0618 |
| Demand as Percent of Supply |
45% |
32% |
34% |
36% |
39% |
41% |

The purpose of the above chart is to show a general indication of how the long-term per capita water demand changes over time. The per capita water demand may actually be different than indicated due to seasonal populations and the accuracy of data submitted. Water systems that have calculated long-term per capita water demand based on a methodology that produces different results may submit their information in the notes field.
Your long-term water demand is 50 gallons per capita per day. What demand management practices do you plan to implement to reduce the per capita water demand (i.e. conduct regular water audits, implement a plumbing retrofit program, employ practices such as rainwater harvesting or reclaimed water)? If these practices are covered elsewhere in your plan, indicate where the practices are discussed here.
No Changes
Are there other demand management practices you will implement to reduce your future supply needs? No Changes
What supplies other than the ones listed in future supplies are being considered to meet your future supply needs? We are working with the Town of Wallace and Engineers on renegotiating our purchase water contract to meet these future increased water demands.
How does the water system intend to implement the demand management and supply planning components above? No Changes
Additional Information
Has this system participated in regional water supply or water use planning? No
What major water supply reports or studies were used for planning?
Please describe any other needs or issues regarding your water supply sources, any water system deficiencies or needed improvements (storage, treatment, etc.) or your ability to meet present and future water needs. Include both quantity and quality considerations, as well as financial, technical, managerial, permitting, and compliance issues:
The Division of Water Resources (DWR) provides the data contained within this
Local Water Supply Plan (LWSP) as a courtesy and service to our customers.
DWR staff does not field verify data. Neither DWR, nor any other party
involved in the preparation of this LWSP attests that the data is completely
free of errors and omissions. Furthermore, data users are cautioned that
LWSPs labeled PROVISIONAL have yet to be reviewed by DWR staff. Subsequent
review may result in significant revision. Questions regarding the accuracy
or limitations of usage of this data should be directed to the water system
and/or DWR.
|