|
The Division of Water Resources (DWR) provides the data contained within this
Local Water Supply Plan (LWSP) as a courtesy and service to our customers.
DWR staff does not field verify data. Neither DWR, nor any other party
involved in the preparation of this LWSP attests that the data is completely
free of errors and omissions. Furthermore, data users are cautioned that
LWSPs labeled PROVISIONAL have yet to be reviewed by DWR staff. Subsequent
review may result in significant revision. Questions regarding the accuracy
or limitations of usage of this data should be directed to the water system
and/or DWR.
1. System Information
Contact Information
Complete
| Water System Name: |
Greene County RWS |
|
PWSID: |
04-40-106 |
| Mailing Address: | P.O. Box 543
Snow Hill, NC 28580 | Ownership: | County |
| |
| Contact Person: | David Jones | Title: | Director |
| Phone: | 252-747-5720 | Cell/Mobile: | 252-939-5721 |
| |
| Secondary Contact: | Richard B. Moore | | Phone: | 252-753-2139 |
| Mailing Address: | McDavid Associates, Inc., P.O. Drawer 49
Farmville, NC 27828 | Cell/Mobile: | 252-939-5721 |
Distribution System
| Line Type |
Size Range (Inches) |
Estimated % of lines |
| Ductile Iron |
6-16 |
4.52 % |
| Polyvinyl Chloride |
2-16 |
95.48 % |
Programs
Water Conservation
2. Water Use Information
Service Area
| Sub-Basin(s) | % of Service Population |
|---|
| Neuse River (10-1) | 100 % |
|
| County(s) | % of Service Population |
|---|
| Greene | 100 % |
|
Service population calculated based on 4,358 customers and 2.61 persons per household. Greene County assumed ownership of the Ormondsville Water Corporation in 2024 and all Ormondsville assets have been transferred to Greene County. Water Use by Type
| Type of Use |
Metered
Connections |
Metered
Average Use (MGD) |
Non-Metered
Connections |
Non-Metered
Estimated Use (MGD) |
| Residential |
4,358 |
0.5231 |
0 |
0.0000 |
| Commercial |
17 |
0.0184 |
0 |
0.0000 |
| Industrial |
0 |
0.0000 |
0 |
0.0000 |
| Institutional |
3 |
0.2022 |
0 |
0.0000 |
How much water was used for system processes (backwash, line cleaning, flushing, etc.)? 0.3000 MGD
Water Sales
| Purchaser |
PWSID |
Average
Daily Sold
(MGD) |
Days
Used |
Contract |
Required to
comply with water
use restrictions? |
Pipe Size(s)
(Inches) |
Use
Type |
| MGD |
Expiration |
Recurring |
| Jason Water Corporation |
04-40-022 |
0.0000 |
0 |
0.0000 |
|
No |
Yes |
6-8 |
Emergency |
| Maury Water Association |
04-40-015 |
0.0347 |
366 |
0.2000 |
2026 |
Yes |
Yes |
8 |
Regular |
| North Lenior Water Corporation |
04-54-025 |
0.0000 |
0 |
0.1000 |
|
Yes |
Yes |
6-8 |
Emergency |
| Shine Water Corporation |
60-40-000 |
0.0000 |
0 |
0.0000 |
|
No |
Yes |
8 |
Emergency |
| South Greene Water Corporation |
04-40-105 |
0.1516 |
366 |
0.3580 |
2026 |
Yes |
Yes |
8 |
Regular |
| Town of Farmville |
04-74-020 |
0.0000 |
0 |
0.0000 |
|
No |
Yes |
8 |
Emergency |
| Town of Hookerton |
04-40-020 |
0.0000 |
0 |
0.0000 |
|
No |
Yes |
8 |
Emergency |
| Town of Snow Hill |
04-40-010 |
0.0000 |
0 |
0.0000 |
|
Yes |
Yes |
10 |
Emergency |
| Town of Walstonburg |
04-40-030 |
0.0111 |
366 |
0.0500 |
2026 |
Yes |
Yes |
8 |
Regular |
3. Water Supply Sources
Monthly Withdrawals & Purchases
|
Average Daily
Use (MGD) |
Max Day
Use (MGD) |
|
Average Daily
Use (MGD) |
Max Day
Use (MGD) |
|
Average Daily
Use (MGD) |
Max Day
Use (MGD) |
| Jan |
1.3317 |
0.6563 |
May |
1.4041 |
1.9300 |
Sep |
1.5135 |
1.9230 |
| Feb |
1.1840 |
1.7523 |
Jun |
1.7046 |
2.2970 |
Oct |
1.3841 |
1.7933 |
| Mar |
1.3479 |
1.9980 |
Jul |
1.5211 |
2.0690 |
Nov |
1.3226 |
1.8823 |
| Apr |
1.3612 |
1.9120 |
Aug |
1.5166 |
1.9200 |
Dec |
1.3018 |
2.1373 |

Ground Water Sources
| Name or Number |
Average Daily Withdrawal (MGD) |
Max Day Withdrawal (MGD) |
12-Hour Supply
(MGD) |
CUA Reduction |
Year Offline |
Use Type |
| MGD |
Days Used |
| 1 |
0.0000 |
0 |
0 |
0.0000 |
CUA0 |
|
Emergency |
| 10 |
0.1481 |
197 |
0.2480 |
0.2160 |
CUA25 |
|
Regular |
| 11 |
0.1548 |
152 |
0.2900 |
0.2160 |
CUA25 |
|
Regular |
| 12 |
0.1689 |
196 |
0.3230 |
0.2160 |
CUA25 |
|
Regular |
| 2 |
0.0000 |
0 |
0 |
0.0000 |
CUA25 |
|
Emergency |
| 3 |
0.1625 |
197 |
0.5070 |
0.2822 |
CUA25 |
|
Regular |
| 4 |
0.2103 |
196 |
0.3740 |
0.2880 |
CUA25 |
|
Regular |
| 5 |
0.2216 |
197 |
0.3830 |
0.3348 |
CUA25 |
|
Regular |
| 7 |
0.1839 |
196 |
0.3390 |
0.2340 |
CUA25 |
|
Regular |
| 8 |
0.1417 |
197 |
0.2330 |
0.2160 |
CUA25 |
|
Regular |
| 9 |
0.1554 |
178 |
0.2680 |
0.2016 |
CUA25 |
|
Regular |
Ground Water Sources (continued)
| Name or Number |
Well Depth (Feet) |
Casing Depth
(Feet) |
Screen Depth (Feet) |
Well Diameter (Inches) |
Pump Intake Depth (Feet) |
Metered? |
| Top |
Bottom |
| 1 |
385 |
|
230 |
380 |
10 |
|
Yes |
| 10 |
341 |
|
250 |
336 |
12 |
242 |
Yes |
| 11 |
333 |
|
268 |
328 |
12 |
256 |
Yes |
| 12 |
389 |
|
316 |
384 |
12 |
268 |
Yes |
| 2 |
251 |
|
178 |
246 |
10 |
206 |
Yes |
| 3 |
319 |
|
286 |
314 |
10 |
250 |
Yes |
| 4 |
367 |
|
295 |
362 |
10 |
248 |
Yes |
| 5 |
338 |
|
300 |
328 |
10 |
254 |
Yes |
| 7 |
312 |
|
268 |
302 |
10 |
255 |
Yes |
| 8 |
335 |
|
245 |
330 |
12 |
237 |
Yes |
| 9 |
397 |
|
330 |
392 |
12 |
310 |
Yes |
Water Purchases From Other Systems
| Seller |
PWSID |
Average
Daily Purchased
(MGD) |
Days
Used |
Contract |
Required to
comply with water
use restrictions? |
Pipe Size(s)
(Inches) |
Use
Type |
| MGD |
Expiration |
Recurring |
| Greenville Utilities Commission |
04-74-010 |
1.3406 |
170 |
2.1440 |
2048 |
Yes |
Yes |
16 |
Regular |
| North Lenior Water Corporation |
04-54-025 |
0.0000 |
0 |
|
|
Yes |
Yes |
8 |
Emergency |
| Town of Hookerton |
04-40-020 |
0.0023 |
365 |
|
|
Yes |
Yes |
6 |
Regular |
| Town of Farmville |
04-74-020 |
0.0000 |
0 |
|
|
Yes |
No |
8 |
Emergency |
| Town of Snow Hill |
04-40-010 |
0.0000 |
0 |
|
|
Yes |
No |
10 |
Emergency |
4. Wastewater Information
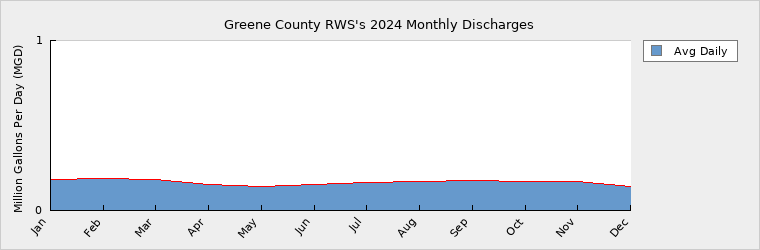
Monthly Discharges
|
Average Daily
Discharge (MGD) |
|
Average Daily
Discharge (MGD) |
|
Average Daily
Discharge (MGD) |
| Jan |
0.1830 |
May |
0.1440 |
Sep |
0.1752 |
| Feb |
0.1869 |
Jun |
0.1544 |
Oct |
0.1712 |
| Mar |
0.1824 |
Jul |
0.1623 |
Nov |
0.1729 |
| Apr |
0.1538 |
Aug |
0.1683 |
Dec |
0.1427 |
Wastewater Interconnections
| Water System |
PWSID |
Type |
Average Daily Amount |
Contract
Maximum (MGD) |
| MGD |
Days Used |
| City of Kinston |
04-54-010 |
Discharging |
0.0076 |
365 |
0.3000 |
| Town of Farmville |
04-74-020 |
Discharging |
0.1592 |
365 |
0.3000 |
5. Planning
Projections
| |
2024 |
2030 |
2040 |
2050 |
2060 |
2070 |
| Year-Round Population |
11,374 |
11,155 |
11,155 |
11,155 |
11,155 |
11,155 |
| Seasonal Population |
0 |
0 |
0 |
0 |
0 |
0 |
| |
| Residential |
0.5231 |
0.5130 |
0.5130 |
0.5130 |
0.5130 |
0.5130 |
| Commercial |
0.0184 |
0.0181 |
0.0181 |
0.0181 |
0.0181 |
0.0181 |
| Industrial |
0.0000 |
0.0000 |
0.0000 |
0.0000 |
0.0000 |
0.0000 |
| Institutional |
0.2022 |
0.1983 |
0.1983 |
0.1983 |
0.1983 |
0.1983 |
| System Process |
0.3000 |
0.3000 |
0.3000 |
0.3000 |
0.3000 |
0.3000 |
| Unaccounted-for |
0.1880 |
0.1989 |
0.1989 |
0.1989 |
0.1989 |
0.1989 |
NC Office of State Budget and Management predict no change in population (slight decline). In lieu of showing a consistent reduction in projected demands, projections are kept at predicted 2030 values. Demand v/s Percent of Supply
| |
2024 |
2030 |
2040 |
2050 |
2060 |
2070 |
| Surface Water Supply |
0.0000 |
0.0000 |
0.0000 |
0.0000 |
0.0000 |
0.0000 |
| Ground Water Supply |
1.6641 |
1.6641 |
1.6641 |
1.6641 |
1.6641 |
1.6641 |
| Purchases |
2.1463 |
2.1463 |
2.1463 |
2.1463 |
2.1463 |
2.1463 |
| Future Supplies |
0.0000 |
0.0000 |
0.0000 |
0.0000 |
0.0000 |
| Total Available Supply (MGD) |
3.8104 |
3.8104 |
3.8104 |
3.8104 |
3.8104 |
3.8104 |
| Service Area Demand |
1.2317 |
1.2283 |
1.2283 |
1.2283 |
1.2283 |
1.2283 |
| Sales |
0.1974 |
0.6080 |
0.6080 |
0.6080 |
0.6080 |
0.6080 |
| Future Sales |
0.0000 |
0.0000 |
0.0000 |
0.0000 |
0.0000 |
| Total Demand (MGD) |
1.4291 |
1.8363 |
1.8363 |
1.8363 |
1.8363 |
1.8363 |
| Demand as Percent of Supply |
38% |
48% |
48% |
48% |
48% |
48% |

The purpose of the above chart is to show a general indication of how the long-term per capita water demand changes over time. The per capita water demand may actually be different than indicated due to seasonal populations and the accuracy of data submitted. Water systems that have calculated long-term per capita water demand based on a methodology that produces different results may submit their information in the notes field.
Your long-term water demand is 46 gallons per capita per day. What demand management practices do you plan to implement to reduce the per capita water demand (i.e. conduct regular water audits, implement a plumbing retrofit program, employ practices such as rainwater harvesting or reclaimed water)? If these practices are covered elsewhere in your plan, indicate where the practices are discussed here.
The County has previously invested in an advanced metering infrastructure system that replaced all water meters. AMI assets have aided in accuracy. The County is preparing to upgrade AMI transmitter assets to further improve operation of metering/billing to support reduced water losses. The County has recently upgraded/replaced its Supervisory Control and Data Acquisition (SCADA) system to further aid in reducing water losses. AMI and SCADA assets have assisted in reduction in water demand, supporting extending the capabilities of existing water supply resources.
Are there other demand management practices you will implement to reduce your future supply needs? None at the moment.
What supplies other than the ones listed in future supplies are being considered to meet your future supply needs? None at the moment.
How does the water system intend to implement the demand management and supply planning components above? Demand management is currently handled internally. The County has invested in the manpower and resources to maintain supply resources to meet future demands.
Additional Information
Has this system participated in regional water supply or water use planning? Yes, Greene County has previously participated in regional water supply planning through initial development of Central Coastal Plain Capacity Use Area (CCPCUA) rules. Greene County has interlocal agreements with Greenville Utilities Commission to comply with CCPCUA rules.
What major water supply reports or studies were used for planning? None
Please describe any other needs or issues regarding your water supply sources, any water system deficiencies or needed improvements (storage, treatment, etc.) or your ability to meet present and future water needs. Include both quantity and quality considerations, as well as financial, technical, managerial, permitting, and compliance issues: None
The Division of Water Resources (DWR) provides the data contained within this
Local Water Supply Plan (LWSP) as a courtesy and service to our customers.
DWR staff does not field verify data. Neither DWR, nor any other party
involved in the preparation of this LWSP attests that the data is completely
free of errors and omissions. Furthermore, data users are cautioned that
LWSPs labeled PROVISIONAL have yet to be reviewed by DWR staff. Subsequent
review may result in significant revision. Questions regarding the accuracy
or limitations of usage of this data should be directed to the water system
and/or DWR.
|