|
The Division of Water Resources (DWR) provides the data contained within this
Local Water Supply Plan (LWSP) as a courtesy and service to our customers.
DWR staff does not field verify data. Neither DWR, nor any other party
involved in the preparation of this LWSP attests that the data is completely
free of errors and omissions. Furthermore, data users are cautioned that
LWSPs labeled PROVISIONAL have yet to be reviewed by DWR staff. Subsequent
review may result in significant revision. Questions regarding the accuracy
or limitations of usage of this data should be directed to the water system
and/or DWR.
1. System Information
Contact Information
Complete
| Water System Name: |
Halifax County |
|
PWSID: |
04-42-040 |
| Mailing Address: | PO Box 70
Halifax, NC 27839 | Ownership: | County |
| |
| Contact Person: | Christopher Williams | Title: | Public Utilities Director |
| Phone: | 252-583-1451 | Cell/Mobile: | -- |
Distribution System
| Line Type |
Size Range (Inches) |
Estimated % of lines |
| Ductile Iron |
6-12 |
2.00 % |
| Polyvinyl Chloride |
6-20 |
98.00 % |
Programs
Water Conservation
2. Water Use Information
Service Area
| Sub-Basin(s) | % of Service Population |
|---|
| Roanoke River (14-1) | 67 % |
| Fishing Creek (15-2) | 33 % |
|
| County(s) | % of Service Population |
|---|
| Halifax | 100 % |
|
Water Use by Type
| Type of Use |
Metered
Connections |
Metered
Average Use (MGD) |
Non-Metered
Connections |
Non-Metered
Estimated Use (MGD) |
| Residential |
8,265 |
0.8544 |
0 |
0.0000 |
| Commercial |
402 |
0.1673 |
0 |
0.0000 |
| Industrial |
4 |
0.3758 |
0 |
0.0000 |
| Institutional |
12 |
0.2273 |
0 |
0.0000 |
How much water was used for system processes (backwash, line cleaning, flushing, etc.)? 0.1500 MGD
Meter replacements have been improved for this calendar year and we have focused on large meter replacements. We continue to struggle with service leaks and non-revenue water. Currently in the process of installing AMI network so once fully operational that should help us identify losses more efficiently. Water Sales
| Purchaser |
PWSID |
Average
Daily Sold
(MGD) |
Days
Used |
Contract |
Required to
comply with water
use restrictions? |
Pipe Size(s)
(Inches) |
Use
Type |
| MGD |
Expiration |
Recurring |
| RRSD |
04-42-010 |
0.0000 |
0 |
|
|
|
Yes |
12 |
Emergency |
| Town of Enfield |
04-42-025 |
0.3070 |
1 |
0.2000 |
2024 |
Yes |
Yes |
12 |
Emergency |
| Town of Halifax |
04-42-030 |
0.0147 |
365 |
0.1250 |
2024 |
Yes |
Yes |
12 |
Regular |
| Town of Littleton |
04-42-028 |
0.0916 |
365 |
0.1900 |
2029 |
Yes |
Yes |
12 |
Regular |
| Town of Scotland Neck |
04-42-015 |
0.2749 |
365 |
0.4000 |
2036 |
Yes |
Yes |
12 |
Regular |
The Scotland Neck contract is for 0.875 mgd but demand is not forecasted to get over 0.30 mgd by 2020. The Halifax demand is not expected to get over 0.02 mgd in the future. 3. Water Supply Sources
Monthly Withdrawals & Purchases
|
Average Daily
Use (MGD) |
Max Day
Use (MGD) |
|
Average Daily
Use (MGD) |
Max Day
Use (MGD) |
|
Average Daily
Use (MGD) |
Max Day
Use (MGD) |
| Jan |
3.0937 |
|
May |
3.0118 |
|
Sep |
3.2408 |
|
| Feb |
2.9336 |
|
Jun |
3.2580 |
|
Oct |
3.0284 |
|
| Mar |
2.8103 |
|
Jul |
2.9116 |
|
Nov |
2.8777 |
|
| Apr |
2.9337 |
|
Aug |
3.1501 |
|
Dec |
2.6656 |
|

Ground Water Sources
| Name or Number |
Average Daily Withdrawal (MGD) |
Max Day Withdrawal (MGD) |
12-Hour Supply
(MGD) |
CUA Reduction |
Year Offline |
Use Type |
| MGD |
Days Used |
| 1 - Essex |
0.0000 |
0 |
|
0.0840 |
|
|
Emergency |
| 2 - Twin County Rural Health |
0.0000 |
0 |
|
0.0290 |
|
|
Emergency |
| 3 - Ringwood |
0.0000 |
0 |
|
0.0790 |
|
|
Emergency |
Ground Water Sources (continued)
| Name or Number |
Well Depth (Feet) |
Casing Depth
(Feet) |
Screen Depth (Feet) |
Well Diameter (Inches) |
Pump Intake Depth (Feet) |
Metered? |
| Top |
Bottom |
| 1 - Essex |
420 |
45 |
0 |
0 |
6 |
|
Yes |
| 2 - Twin County Rural Health |
311 |
132 |
0 |
0 |
6 |
|
Yes |
| 3 - Ringwood |
450 |
124 |
0 |
0 |
6 |
120 |
Yes |
Water Purchases From Other Systems
| Seller |
PWSID |
Average
Daily Purchased
(MGD) |
Days
Used |
Contract |
Required to
comply with water
use restrictions? |
Pipe Size(s)
(Inches) |
Use
Type |
| MGD |
Expiration |
Recurring |
| Roanoke Rapids Sanitary District |
04-42-010 |
2.2480 |
365 |
3.0000 |
2047 |
Yes |
Yes |
12 |
Regular |
| Town of Enfield |
04-42-025 |
0.0000 |
0 |
0.1500 |
2034 |
Yes |
Yes |
6 - 8 |
Emergency |
| Town of Weldon |
04-42-020 |
0.7399 |
365 |
0.9000 |
2047 |
Yes |
Yes |
12 |
Regular |
Purchase numbers from RRSD and Weldon are from billing. We have been told that RRSD can and will supply us with whatever we are able to and willing to purchase. We have also been approached by the Town of Weldon about partnering with them on construction of a new water treatment plant but that is still in the initial discussion phase. 4. Wastewater Information
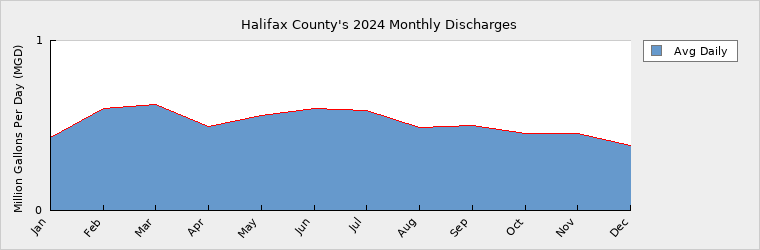
Monthly Discharges
|
Average Daily
Discharge (MGD) |
|
Average Daily
Discharge (MGD) |
|
Average Daily
Discharge (MGD) |
| Jan |
0.4278 |
May |
0.5563 |
Sep |
0.4990 |
| Feb |
0.5992 |
Jun |
0.6020 |
Oct |
0.4503 |
| Mar |
0.6243 |
Jul |
0.5881 |
Nov |
0.4550 |
| Apr |
0.4940 |
Aug |
0.4904 |
Dec |
0.3842 |
Wastewater Interconnections
| Water System |
PWSID |
Type |
Average Daily Amount |
Contract
Maximum (MGD) |
| MGD |
Days Used |
| Roanoke Rapids Sanitation Dis. |
04-42-010 |
Discharging |
0.3835 |
365 |
|
| Town of Enfield |
04-42-025 |
Discharging |
0.0000 |
0 |
|
| Town of Weldon |
04-42-020 |
Discharging |
0.1173 |
365 |
0.5500 |
Flow from industrial user in Halifax County is billed directly by Roanoke Rapids Sanitary District so it is not included in amount received by RRSD. 5. Planning
Projections
| |
2024 |
2030 |
2040 |
2050 |
2060 |
2070 |
| Year-Round Population |
20,250 |
20,556 |
21,075 |
21,608 |
22,155 |
22,715 |
| Seasonal Population |
0 |
0 |
0 |
0 |
0 |
0 |
| |
| Residential |
0.8544 |
0.8673 |
0.8892 |
0.9117 |
0.9348 |
0.9584 |
| Commercial |
0.1673 |
0.1698 |
0.1741 |
0.1785 |
0.1830 |
0.1877 |
| Industrial |
0.3758 |
0.3815 |
0.3911 |
0.4010 |
0.4111 |
0.4215 |
| Institutional |
0.2273 |
0.2307 |
0.2366 |
0.2425 |
0.2487 |
0.2550 |
| System Process |
0.1500 |
0.1523 |
0.1561 |
0.1601 |
0.1641 |
0.1683 |
| Unaccounted-for |
0.8239 |
0.8383 |
0.8595 |
0.8812 |
0.9035 |
0.9263 |
Numbers for this portion are significantly different than last year because I used the provided online tool to calculate this year. Also, I performed a better calculation of our system growth and population growth and applied that this year. Demand v/s Percent of Supply
| |
2024 |
2030 |
2040 |
2050 |
2060 |
2070 |
| Surface Water Supply |
0.0000 |
0.0000 |
0.0000 |
0.0000 |
0.0000 |
0.0000 |
| Ground Water Supply |
0.0000 |
0.0000 |
0.0000 |
0.0000 |
0.0000 |
0.0000 |
| Purchases |
3.9000 |
3.9000 |
3.9000 |
3.9000 |
3.9000 |
3.9000 |
| Future Supplies |
0.0000 |
0.0000 |
0.0000 |
0.0000 |
0.0000 |
| Total Available Supply (MGD) |
3.9000 |
3.9000 |
3.9000 |
3.9000 |
3.9000 |
3.9000 |
| Service Area Demand |
2.5987 |
2.6399 |
2.7066 |
2.7750 |
2.8452 |
2.9172 |
| Sales |
0.3810 |
0.7150 |
0.7150 |
0.7150 |
0.7150 |
0.7150 |
| Future Sales |
0.0000 |
0.0000 |
0.0000 |
0.0000 |
0.0000 |
| Total Demand (MGD) |
2.9797 |
3.3549 |
3.4216 |
3.4900 |
3.5602 |
3.6322 |
| Demand as Percent of Supply |
76% |
86% |
88% |
89% |
91% |
93% |

The purpose of the above chart is to show a general indication of how the long-term per capita water demand changes over time. The per capita water demand may actually be different than indicated due to seasonal populations and the accuracy of data submitted. Water systems that have calculated long-term per capita water demand based on a methodology that produces different results may submit their information in the notes field.
Your long-term water demand is 42 gallons per capita per day. What demand management practices do you plan to implement to reduce the per capita water demand (i.e. conduct regular water audits, implement a plumbing retrofit program, employ practices such as rainwater harvesting or reclaimed water)? If these practices are covered elsewhere in your plan, indicate where the practices are discussed here.
No changes
Are there other demand management practices you will implement to reduce your future supply needs? No changes
What supplies other than the ones listed in future supplies are being considered to meet your future supply needs? Excess supply available with RR Sanitary District
How does the water system intend to implement the demand management and supply planning components above? Excess capacity available from RR Sanitary District when needed
Additional Information
Has this system participated in regional water supply or water use planning? No
What major water supply reports or studies were used for planning?
Please describe any other needs or issues regarding your water supply sources, any water system deficiencies or needed improvements (storage, treatment, etc.) or your ability to meet present and future water needs. Include both quantity and quality considerations, as well as financial, technical, managerial, permitting, and compliance issues:
The Division of Water Resources (DWR) provides the data contained within this
Local Water Supply Plan (LWSP) as a courtesy and service to our customers.
DWR staff does not field verify data. Neither DWR, nor any other party
involved in the preparation of this LWSP attests that the data is completely
free of errors and omissions. Furthermore, data users are cautioned that
LWSPs labeled PROVISIONAL have yet to be reviewed by DWR staff. Subsequent
review may result in significant revision. Questions regarding the accuracy
or limitations of usage of this data should be directed to the water system
and/or DWR.
|