|
The Division of Water Resources (DWR) provides the data contained within this
Local Water Supply Plan (LWSP) as a courtesy and service to our customers.
DWR staff does not field verify data. Neither DWR, nor any other party
involved in the preparation of this LWSP attests that the data is completely
free of errors and omissions. Furthermore, data users are cautioned that
LWSPs labeled PROVISIONAL have yet to be reviewed by DWR staff. Subsequent
review may result in significant revision. Questions regarding the accuracy
or limitations of usage of this data should be directed to the water system
and/or DWR.
1. System Information
Contact Information
Complete
| Water System Name: |
Maysville |
|
PWSID: |
04-52-010 |
| Mailing Address: | P.O. Box 265
Maysville, NC 28555 | Ownership: | Municipality |
| |
| Contact Person: | Schumata Brown | Title: | Town Manager |
| Phone: | 910-734-4441 | Cell/Mobile: | -- |
| |
| Secondary Contact: | John Malone | | Phone: | 336-780-0786 |
| Mailing Address: |
, | Cell/Mobile: | -- |
Distribution System
| Line Type |
Size Range (Inches) |
Estimated % of lines |
| Asbestos Cement |
6-8 |
5.33 % |
| Galvanized Iron |
2 |
0.00 % |
| Polyvinyl Chloride |
4-8 |
94.67 % |
Most meters in the system were replaced in 2020. Maysville replaced 2,964 feet of 8” ACP with 8” PVC as part of the Main St Water Line Project. Programs
NCRWA provides leak detection services on an as needed basis. Water Conservation
The system is connected with Jones County Water System as the primary source of water. A new treatment system is schedule to come online in 2025, making Jones County an emergency source. 2. Water Use Information
Service Area
| Sub-Basin(s) | % of Service Population |
|---|
| White Oak River (17-1) | 100 % |
|
| County(s) | % of Service Population |
|---|
| Jones | 100 % |
|
Population decrease based on 2.45 persons per household. This was based on previous PWS persons per household x connections = Population. Water Use by Type
| Type of Use |
Metered
Connections |
Metered
Average Use (MGD) |
Non-Metered
Connections |
Non-Metered
Estimated Use (MGD) |
| Residential |
400 |
0.0398 |
0 |
0.0000 |
| Commercial |
42 |
0.0051 |
0 |
0.0000 |
| Industrial |
0 |
0.0000 |
0 |
0.0000 |
| Institutional |
0 |
0.0000 |
1 |
0.0146 |
How much water was used for system processes (backwash, line cleaning, flushing, etc.)? 0.0010 MGD
Water Sales
| Purchaser |
PWSID |
Average
Daily Sold
(MGD) |
Days
Used |
Contract |
Required to
comply with water
use restrictions? |
Pipe Size(s)
(Inches) |
Use
Type |
| MGD |
Expiration |
Recurring |
| Jones County Regional Water System |
04-52-020 |
0.0000 |
0 |
0.0000 |
|
Yes |
Yes |
6 |
Emergency |
3. Water Supply Sources
Monthly Withdrawals & Purchases
|
Average Daily
Use (MGD) |
Max Day
Use (MGD) |
|
Average Daily
Use (MGD) |
Max Day
Use (MGD) |
|
Average Daily
Use (MGD) |
Max Day
Use (MGD) |
| Jan |
0.0658 |
|
May |
0.0735 |
|
Sep |
0.0658 |
|
| Feb |
0.0624 |
|
Jun |
0.0743 |
|
Oct |
0.0709 |
|
| Mar |
0.0630 |
|
Jul |
0.0743 |
|
Nov |
0.0702 |
|
| Apr |
0.0595 |
|
Aug |
0.0741 |
|
Dec |
0.0732 |
|
All water was purchased from Jones County in 2024. The meter is not read daily; no way to determine max day. These readings are based on manual meter reads on the last day of each month and are what is reported in the GW/PW MOR system. Well sources did not run in 2024. 
Ground Water Sources
| Name or Number |
Average Daily Withdrawal (MGD) |
Max Day Withdrawal (MGD) |
12-Hour Supply
(MGD) |
CUA Reduction |
Year Offline |
Use Type |
| MGD |
Days Used |
| 1 |
0.0000 |
0 |
|
0.1728 |
CUA0 |
|
Regular |
| 2 |
0.0000 |
0 |
|
0.1728 |
CUA0 |
|
Regular |
Ground Water Sources (continued)
| Name or Number |
Well Depth (Feet) |
Casing Depth
(Feet) |
Screen Depth (Feet) |
Well Diameter (Inches) |
Pump Intake Depth (Feet) |
Metered? |
| Top |
Bottom |
| 1 |
300 |
|
65 |
300 |
8 |
50 |
Yes |
| 2 |
300 |
|
100 |
300 |
8 |
75 |
Yes |
No Recorded water withdrawal during 2024 from the well sources. All Water used by the Town was purchased from Jones County. Water Purchases From Other Systems
| Seller |
PWSID |
Average
Daily Purchased
(MGD) |
Days
Used |
Contract |
Required to
comply with water
use restrictions? |
Pipe Size(s)
(Inches) |
Use
Type |
| MGD |
Expiration |
Recurring |
| Jones County Regional Water System |
04-52-020 |
0.0689 |
366 |
0.0000 |
|
Yes |
Yes |
6 |
Regular |
Purchase amounts based on Monthly Billing from Jones County. Water Treatment Plants
| Plant Name |
Permitted Capacity
(MGD) |
Is Raw Water Metered? |
Is Finished Water Ouput Metered? |
Source |
| Maysville |
0.1440 |
Yes |
Yes |
Castle Hayne |
Water Treatment Plant was not used in 2024. Additional engineering and equipment replacement is needed to bring the treatment plant online after 2023 upgrades were completed. 4. Wastewater Information
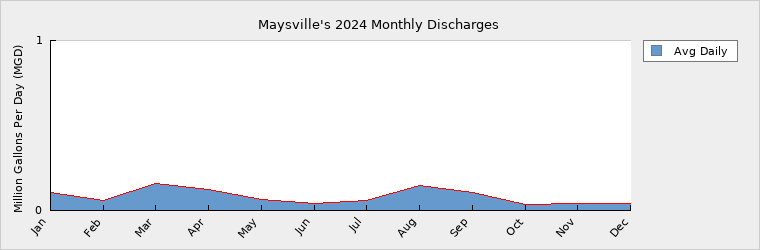
Monthly Discharges
|
Average Daily
Discharge (MGD) |
|
Average Daily
Discharge (MGD) |
|
Average Daily
Discharge (MGD) |
| Jan |
0.1069 |
May |
0.0644 |
Sep |
0.1035 |
| Feb |
0.0572 |
Jun |
0.0413 |
Oct |
0.0380 |
| Mar |
0.1605 |
Jul |
0.0613 |
Nov |
0.0426 |
| Apr |
0.1237 |
Aug |
0.1459 |
Dec |
0.0414 |
Wastewater Permits
| Permit Number |
Type |
Permitted Capacity
(MGD) |
Design Capacity
(MGD) |
Average Annual
Daily Discharge
(MGD) |
Maximum Day Discharge
(MGD) |
Receiving Stream |
Receiving Basin |
| NC0021482 |
WWTP |
0.1800 |
0.1800 |
0.0822 |
0.6330 |
White Oak River |
White Oak River (17-1) |
Only minor improvements and rehabilitation are planned for the WWTP. 5. Planning
Projections
| |
2024 |
2030 |
2040 |
2050 |
2060 |
2070 |
| Year-Round Population |
1,083 |
980 |
820 |
685 |
573 |
479 |
| Seasonal Population |
0 |
0 |
0 |
0 |
0 |
0 |
| |
| Residential |
0.0398 |
0.0360 |
0.0300 |
0.0250 |
0.0200 |
0.0174 |
| Commercial |
0.0051 |
0.0046 |
0.0038 |
0.0032 |
0.0027 |
0.0022 |
| Industrial |
0.0000 |
0.0000 |
0.0000 |
0.0000 |
0.0000 |
0.0000 |
| Institutional |
0.0146 |
0.0132 |
0.0110 |
0.0092 |
0.0077 |
0.0064 |
| System Process |
0.0010 |
0.0010 |
0.0013 |
0.0013 |
0.0015 |
0.0015 |
| Unaccounted-for |
0.0084 |
0.0076 |
0.0064 |
0.0054 |
0.0044 |
0.0038 |
Institutional connection is a recreational splash pad use is estimated. Projections based on a negative 1.97% growth rate per change in population between 2010 & 2020 utilizing census data. Demand v/s Percent of Supply
| |
2024 |
2030 |
2040 |
2050 |
2060 |
2070 |
| Surface Water Supply |
0.0000 |
0.0000 |
0.0000 |
0.0000 |
0.0000 |
0.0000 |
| Ground Water Supply |
0.1728 |
0.1728 |
0.1728 |
0.1728 |
0.1728 |
0.1728 |
| Purchases |
0.0689 |
0.0689 |
0.0689 |
0.0689 |
0.0689 |
0.0689 |
| Future Supplies |
0.0000 |
0.0000 |
0.0000 |
0.0000 |
0.0000 |
| Total Available Supply (MGD) |
0.2417 |
0.2417 |
0.2417 |
0.2417 |
0.2417 |
0.2417 |
| Service Area Demand |
0.0689 |
0.0624 |
0.0525 |
0.0441 |
0.0363 |
0.0313 |
| Sales |
0.0000 |
0.0000 |
0.0000 |
0.0000 |
0.0000 |
0.0000 |
| Future Sales |
0.0000 |
0.0000 |
0.0000 |
0.0000 |
0.0000 |
| Total Demand (MGD) |
0.0689 |
0.0624 |
0.0525 |
0.0441 |
0.0363 |
0.0313 |
| Demand as Percent of Supply |
29% |
26% |
22% |
18% |
15% |
13% |

The purpose of the above chart is to show a general indication of how the long-term per capita water demand changes over time. The per capita water demand may actually be different than indicated due to seasonal populations and the accuracy of data submitted. Water systems that have calculated long-term per capita water demand based on a methodology that produces different results may submit their information in the notes field.
Your long-term water demand is 37 gallons per capita per day. What demand management practices do you plan to implement to reduce the per capita water demand (i.e. conduct regular water audits, implement a plumbing retrofit program, employ practices such as rainwater harvesting or reclaimed water)? If these practices are covered elsewhere in your plan, indicate where the practices are discussed here.
No Changes
Are there other demand management practices you will implement to reduce your future supply needs? No Changes
What supplies other than the ones listed in future supplies are being considered to meet your future supply needs? The Town of Maysville has instituted a project to replace well # 1 with a new source. Well #1 currently feeds the Water Treatment Plant. The new source is not expected to require PFAS removal, only softening and iron removal.
How does the water system intend to implement the demand management and supply planning components above? N/A
Additional Information
Has this system participated in regional water supply or water use planning? No
What major water supply reports or studies were used for planning?
Please describe any other needs or issues regarding your water supply sources, any water system deficiencies or needed improvements (storage, treatment, etc.) or your ability to meet present and future water needs. Include both quantity and quality considerations, as well as financial, technical, managerial, permitting, and compliance issues: None
The Division of Water Resources (DWR) provides the data contained within this
Local Water Supply Plan (LWSP) as a courtesy and service to our customers.
DWR staff does not field verify data. Neither DWR, nor any other party
involved in the preparation of this LWSP attests that the data is completely
free of errors and omissions. Furthermore, data users are cautioned that
LWSPs labeled PROVISIONAL have yet to be reviewed by DWR staff. Subsequent
review may result in significant revision. Questions regarding the accuracy
or limitations of usage of this data should be directed to the water system
and/or DWR.
|