|
The Division of Water Resources (DWR) provides the data contained within this
Local Water Supply Plan (LWSP) as a courtesy and service to our customers.
DWR staff does not field verify data. Neither DWR, nor any other party
involved in the preparation of this LWSP attests that the data is completely
free of errors and omissions. Furthermore, data users are cautioned that
LWSPs labeled PROVISIONAL have yet to be reviewed by DWR staff. Subsequent
review may result in significant revision. Questions regarding the accuracy
or limitations of usage of this data should be directed to the water system
and/or DWR.
1. System Information
Contact Information
Complete
| Water System Name: |
Kinston |
|
PWSID: |
04-54-010 |
| Mailing Address: | P.O. Box 339
Kinston, NC 28502 | Ownership: | Municipality |
| |
| Contact Person: | Stephen Miller | Title: | Public Services Director |
| Phone: | 252-939-3303 | Cell/Mobile: | -- |
| |
| Secondary Contact: | Joey pittman | | Phone: | 252-939-3286 |
| Mailing Address: | P.O. Box 339
Kinston, NC 28502 | Cell/Mobile: | -- |
Distribution System
| Line Type |
Size Range (Inches) |
Estimated % of lines |
| Asbestos Cement |
6-16 |
10.00 % |
| Cast Iron |
6-18 |
15.70 % |
| Ductile Iron |
6-18 |
35.30 % |
| Galvanized Iron |
1-3 |
9.60 % |
| Polyvinyl Chloride |
2-16 |
29.40 % |
Replacement involved work in the Lawrence Hgts project. Programs
Water Conservation
Interconnection with North Lenoir Water Corporation 2. Water Use Information
Service Area
| Sub-Basin(s) | % of Service Population |
|---|
| Neuse River (10-1) | 100 % |
|
| County(s) | % of Service Population |
|---|
| Lenoir | 100 % |
|
Water Use by Type
| Type of Use |
Metered
Connections |
Metered
Average Use (MGD) |
Non-Metered
Connections |
Non-Metered
Estimated Use (MGD) |
| Residential |
11,138 |
2.0639 |
0 |
0.0000 |
| Commercial |
0 |
0.0000 |
0 |
0.0000 |
| Industrial |
28 |
1.8718 |
0 |
0.0000 |
| Institutional |
0 |
0.0000 |
0 |
0.0000 |
How much water was used for system processes (backwash, line cleaning, flushing, etc.)? 0.1100 MGD
Water Sales
| Purchaser |
PWSID |
Average
Daily Sold
(MGD) |
Days
Used |
Contract |
Required to
comply with water
use restrictions? |
Pipe Size(s)
(Inches) |
Use
Type |
| MGD |
Expiration |
Recurring |
| Deep Run Water Corporation |
04-54-030 |
0.0000 |
0 |
0.0000 |
9999 |
Yes |
No |
12 |
Regular |
| North Lenoir Water Corporation |
04-54-025 |
0.0000 |
0 |
0.0000 |
2099 |
Yes |
Yes |
8 |
Emergency |
3. Water Supply Sources
Monthly Withdrawals & Purchases
|
Average Daily
Use (MGD) |
Max Day
Use (MGD) |
|
Average Daily
Use (MGD) |
Max Day
Use (MGD) |
|
Average Daily
Use (MGD) |
Max Day
Use (MGD) |
| Jan |
4.3236 |
6.0489 |
May |
4.4845 |
6.2728 |
Sep |
4.5207 |
5.9467 |
| Feb |
4.0908 |
5.2849 |
Jun |
4.5847 |
7.1865 |
Oct |
4.2909 |
5.4856 |
| Mar |
4.0567 |
5.7496 |
Jul |
4.5723 |
5.8982 |
Nov |
4.2342 |
5.7180 |
| Apr |
4.4144 |
6.1812 |
Aug |
4.4167 |
5.7022 |
Dec |
4.3118 |
5.6637 |

Ground Water Sources
| Name or Number |
Average Daily Withdrawal (MGD) |
Max Day Withdrawal (MGD) |
12-Hour Supply
(MGD) |
CUA Reduction |
Year Offline |
Use Type |
| MGD |
Days Used |
| 1 |
0.1604 |
65 |
0.4280 |
0.1650 |
CUA25 |
|
Regular |
| 1,3 |
0.0000 |
0 |
|
0.0000 |
CUA0 |
|
Regular |
| 10 |
0.0000 |
0 |
0 |
0.2520 |
CUA25 |
|
Regular |
| 11 |
0.5330 |
221 |
1.2370 |
0.7200 |
CUA25 |
|
Regular |
| 12 |
0.4913 |
114 |
0.9940 |
0.7416 |
CUA25 |
|
Regular |
| 13 |
0.2966 |
98 |
0.7680 |
0.3240 |
CUA25 |
|
Regular |
| 14 |
0.1959 |
104 |
0.4680 |
0.4680 |
CUA25 |
|
Regular |
| 16 |
0.1448 |
28 |
0.3190 |
0.5490 |
CUA25 |
|
Regular |
| 18 |
0.0993 |
57 |
0.2130 |
0.4680 |
CUA25 |
|
Regular |
| 20 |
0.0292 |
36 |
0.0320 |
0.0396 |
CUA25 |
|
Regular |
| 21 |
0.3092 |
152 |
0.7710 |
0.3384 |
CUA25 |
|
Regular |
| 23 |
0.0000 |
0 |
0 |
0.2980 |
CUA25 |
|
Emergency |
| 24 |
0.0000 |
0 |
0 |
0.5940 |
CUA25 |
|
Emergency |
| 3 |
0.1874 |
63 |
0.3560 |
0.1440 |
CUA25 |
|
Regular |
| 4 |
0.2710 |
105 |
0.7960 |
0.4680 |
CUA25 |
|
Regular |
| 5 |
0.2627 |
139 |
0.6900 |
0.2880 |
CUA25 |
|
Regular |
| 6 |
0.3133 |
111 |
0.8110 |
0.3240 |
CUA25 |
|
Regular |
| 7 |
0.3286 |
71 |
0.8110 |
0.2736 |
CUA25 |
|
Regular |
| 8 |
0.3433 |
51 |
0.8380 |
0.6120 |
CUA25 |
|
Regular |
| 9 |
0.2806 |
147 |
0.7900 |
0.4960 |
CUA25 |
|
Regular |
| NRWASA-Kinston |
0.0000 |
0 |
0.0000 |
0.0000 |
CUA0 |
|
Regular |
Ground Water Sources (continued)
| Name or Number |
Well Depth (Feet) |
Casing Depth
(Feet) |
Screen Depth (Feet) |
Well Diameter (Inches) |
Pump Intake Depth (Feet) |
Metered? |
| Top |
Bottom |
| 1 |
360 |
|
205 |
356 |
12 |
247 |
Yes |
| 1,3 |
|
|
|
|
|
|
Yes |
| 10 |
415 |
|
250 |
412 |
10 |
274 |
Yes |
| 11 |
420 |
|
302 |
370 |
10 |
234 |
Yes |
| 12 |
490 |
|
270 |
485 |
10 |
237 |
Yes |
| 13 |
395 |
|
302 |
395 |
8 |
195 |
Yes |
| 14 |
405 |
|
240 |
388 |
12 |
200 |
Yes |
| 16 |
325 |
|
271 |
325 |
6 |
210 |
Yes |
| 18 |
330 |
|
270 |
320 |
12 |
138 |
Yes |
| 20 |
312 |
|
183 |
270 |
6 |
168 |
Yes |
| 21 |
439 |
|
379 |
429 |
14 |
320 |
Yes |
| 23 |
453 |
|
300 |
375 |
14 |
0 |
No |
| 24 |
509 |
|
282 |
388 |
14 |
0 |
No |
| 3 |
365 |
|
315 |
365 |
8 |
273 |
Yes |
| 4 |
520 |
|
390 |
515 |
10 |
230 |
Yes |
| 5 |
443 |
|
230 |
433 |
10 |
220 |
Yes |
| 6 |
483 |
|
230 |
447 |
10 |
190 |
Yes |
| 7 |
445 |
|
215 |
440 |
10 |
236 |
Yes |
| 8 |
527 |
|
316 |
482 |
10 |
197 |
Yes |
| 9 |
482 |
|
272 |
482 |
10 |
245 |
Yes |
| NRWASA-Kinston |
|
|
|
|
|
|
Yes |
Water Purchases From Other Systems
| Seller |
PWSID |
Average
Daily Purchased
(MGD) |
Days
Used |
Contract |
Required to
comply with water
use restrictions? |
Pipe Size(s)
(Inches) |
Use
Type |
| MGD |
Expiration |
Recurring |
| North Lenoir Water Corporation |
04-54-025 |
0.0000 |
0 |
0.0000 |
2099 |
Yes |
No |
8 |
Emergency |
| NRWASA |
60-54-001 |
3.0656 |
366 |
3.0705 |
2048 |
Yes |
Yes |
36 |
Regular |
4. Wastewater Information
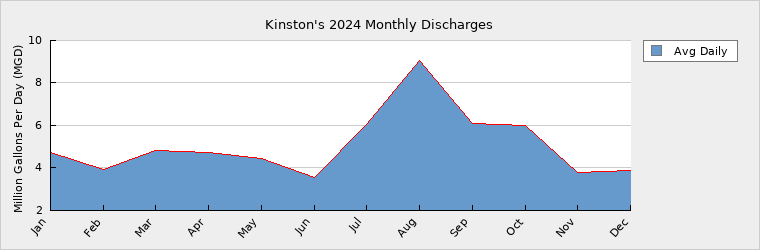
Monthly Discharges
|
Average Daily
Discharge (MGD) |
|
Average Daily
Discharge (MGD) |
|
Average Daily
Discharge (MGD) |
| Jan |
4.7150 |
May |
4.4240 |
Sep |
6.0820 |
| Feb |
3.9300 |
Jun |
3.5330 |
Oct |
6.0070 |
| Mar |
4.8180 |
Jul |
6.0540 |
Nov |
3.7830 |
| Apr |
4.7490 |
Aug |
9.0780 |
Dec |
3.9010 |
Wastewater Permits
| Permit Number |
Type |
Permitted Capacity
(MGD) |
Design Capacity
(MGD) |
Average Annual
Daily Discharge
(MGD) |
Maximum Day Discharge
(MGD) |
Receiving Stream |
Receiving Basin |
| NC0024236 |
WWTP |
11.8500 |
11.8500 |
5.0912 |
20.1600 |
neuse river |
Neuse River (10-1) |
Wastewater Interconnections
| Water System |
PWSID |
Type |
Average Daily Amount |
Contract
Maximum (MGD) |
| MGD |
Days Used |
| Greene County Regional Water |
04-40-106 |
Receiving |
0.0074 |
366 |
0.3000 |
| Town of Cove City |
04-25-045 |
Receiving |
0.0037 |
366 |
0.1000 |
| Town of Dover |
04-25-025 |
Receiving |
0.0749 |
366 |
0.1000 |
5. Planning
Projections
| |
2024 |
2030 |
2040 |
2050 |
2060 |
2070 |
| Year-Round Population |
27,500 |
28,000 |
28,500 |
29,000 |
29,500 |
30,000 |
| Seasonal Population |
0 |
0 |
0 |
0 |
0 |
0 |
| |
| Residential |
2.0639 |
2.1000 |
2.1500 |
2.1800 |
2.2100 |
2.2400 |
| Commercial |
0.0000 |
0.0000 |
0.0000 |
0.0000 |
0.0000 |
0.0000 |
| Industrial |
1.8718 |
2.0000 |
2.2000 |
2.3000 |
2.4000 |
2.5000 |
| Institutional |
0.0000 |
0.0000 |
0.0000 |
0.0000 |
0.0000 |
0.0000 |
| System Process |
0.1100 |
0.1100 |
0.1100 |
0.1100 |
0.1100 |
0.1100 |
| Unaccounted-for |
0.3452 |
0.3500 |
0.3500 |
0.3500 |
0.3500 |
0.3500 |
Future Supply Sources
| Source Name |
PWSID |
Source Type |
Additional Supply |
Year Online |
Year Offline |
Type |
| City of Kinston Banked Water |
04-54-010 |
Ground |
1.1500 |
2025 |
2039 |
Regular |
| City of Kinston Banked Water |
04-54-010 |
Ground |
1.2500 |
2040 |
2049 |
Regular |
| City of Kinston Banked Water |
04-54-010 |
Ground |
1.4500 |
2050 |
2052 |
Regular |
The demand/supply (D/S) percentage for 2024 is 91%, exceeding the 80% ratio considered by DEQ to be the minimum needed for adequate planning purposes. However, as of April 2025, Kinston has 15,113,258,600 gallons of banked under the CCPCUA program which can be counted towards its total available supply. This Banked Water, shown under 'Future Supplies', has been applied to reduce the D/S ratios to less than 80% from 2025 through 2050. Demand v/s Percent of Supply
| |
2024 |
2030 |
2040 |
2050 |
2060 |
2070 |
| Surface Water Supply |
0.0000 |
0.0000 |
0.0000 |
0.0000 |
0.0000 |
0.0000 |
| Ground Water Supply |
1.7432 |
1.7432 |
1.7432 |
1.7432 |
1.7432 |
1.7432 |
| Purchases |
3.0705 |
3.0705 |
3.0705 |
3.0705 |
3.0705 |
3.0705 |
| Future Supplies |
1.1500 |
1.2500 |
1.4500 |
0.0000 |
0.0000 |
| Total Available Supply (MGD) |
4.8137 |
5.9637 |
6.0637 |
6.2637 |
4.8137 |
4.8137 |
| Service Area Demand |
4.3909 |
4.5600 |
4.8100 |
4.9400 |
5.0700 |
5.2000 |
| Sales |
0.0000 |
0.0000 |
0.0000 |
0.0000 |
0.0000 |
0.0000 |
| Future Sales |
0.0000 |
0.0000 |
0.0000 |
0.0000 |
0.0000 |
| Total Demand (MGD) |
4.3909 |
4.5600 |
4.8100 |
4.9400 |
5.0700 |
5.2000 |
| Demand as Percent of Supply |
91% |
76% |
79% |
79% |
105% |
108% |

The purpose of the above chart is to show a general indication of how the long-term per capita water demand changes over time. The per capita water demand may actually be different than indicated due to seasonal populations and the accuracy of data submitted. Water systems that have calculated long-term per capita water demand based on a methodology that produces different results may submit their information in the notes field.
Your long-term water demand is 75 gallons per capita per day. What demand management practices do you plan to implement to reduce the per capita water demand (i.e. conduct regular water audits, implement a plumbing retrofit program, employ practices such as rainwater harvesting or reclaimed water)? If these practices are covered elsewhere in your plan, indicate where the practices are discussed here.
Kinston is promoting web portal access for customers to view their water usage in 15 minute intervals so they can determine usage by specific household appliances and the presence of leaks. Our long-term water demand dropped from 82 gpd last year to 75 gpd this year.
Are there other demand management practices you will implement to reduce your future supply needs? We will continue encouraging retrofits for older appliances/plumbing fixtures and discouraging the use of potable water for irrigation.
What supplies other than the ones listed in future supplies are being considered to meet your future supply needs? Kinston has the option to increase purchased water amounts from the Neuse Regional Water and Sewer Authority. The NRWASA surface water plant is currently operating at about 50% of capacity.
How does the water system intend to implement the demand management and supply planning components above? None of the practices involve any capital investments. A financial analysis will be required should we decide to increase our purchased water allotment from NRWASA.
Additional Information
Has this system participated in regional water supply or water use planning? Yes, Kinston participated in city and county master plans in the 1990's and 2000's. As a member of the Neuse Regional Water and Sewer Authority, Kinston continues to participate in the decisions of NRWASA to ensure a viable water supply for our region in the future.
What major water supply reports or studies were used for planning? 1995 City of Kinston Water Supply Master Plan
2000 Lenoir County Water System Master Plan
2006 City of Kinston Comprehensive Well Study
Please describe any other needs or issues regarding your water supply sources, any water system deficiencies or needed improvements (storage, treatment, etc.) or your ability to meet present and future water needs. Include both quantity and quality considerations, as well as financial, technical, managerial, permitting, and compliance issues: Kinston has continued replacing aging water infrastructure and has recently completed a new condition study of our distribution system. Right now we are faced with the challenges of the EPA's lead service regulations. Although we have not had any lead level exceedances in many years, we will now be forced to spend millions of dollars replacing service lines instead of investing that money in full system upgrades. Next will be PFAS regulations that will force NRWASA and members like Kinston to invest in additional treatment processes to remove PFAS, instead of requiring the industries that created to the problem to pay for the remediation.
The Division of Water Resources (DWR) provides the data contained within this
Local Water Supply Plan (LWSP) as a courtesy and service to our customers.
DWR staff does not field verify data. Neither DWR, nor any other party
involved in the preparation of this LWSP attests that the data is completely
free of errors and omissions. Furthermore, data users are cautioned that
LWSPs labeled PROVISIONAL have yet to be reviewed by DWR staff. Subsequent
review may result in significant revision. Questions regarding the accuracy
or limitations of usage of this data should be directed to the water system
and/or DWR.
|