|
The Division of Water Resources (DWR) provides the data contained within this
Local Water Supply Plan (LWSP) as a courtesy and service to our customers.
DWR staff does not field verify data. Neither DWR, nor any other party
involved in the preparation of this LWSP attests that the data is completely
free of errors and omissions. Furthermore, data users are cautioned that
LWSPs labeled PROVISIONAL have yet to be reviewed by DWR staff. Subsequent
review may result in significant revision. Questions regarding the accuracy
or limitations of usage of this data should be directed to the water system
and/or DWR.
1. System Information
Contact Information
Complete
| Water System Name: |
Cape Fear Public Utility Authority - Wilmington |
|
PWSID: |
04-65-010 |
| Mailing Address: | 235 Government Center Drive
Wilmington, NC 28403 | Ownership: | Authority |
| |
| Contact Person: | Benjamin Kearns | Title: | Water Resources Manager |
| Phone: | 910-332-6577 | Cell/Mobile: | 910-398-4311 |
Distribution System
| Line Type |
Size Range (Inches) |
Estimated % of lines |
| Asbestos Cement |
4-12 |
0.47 % |
| Cast Iron |
1-24 |
11.14 % |
| Ductile Iron |
1-60 |
18.00 % |
| Other |
1-20 |
1.21 % |
| Polyvinyl Chloride |
<1-60 |
69.18 % |
Programs
Water Conservation
Connection between CFPUA and Pender County Utilities for emergency use along an isolated portion of the Hwy 421 Corridor is in design and approved for construction but not yet active. A system consolidation between CFPUA and Wrightsville beach is scheduled for September 2025 with enhanced interconnects under design for completion expected in late 2026. CFPUA is looking at potential connections between CFPUA and other customers, such as Figure Eight Island, on a wholesale basis. 2. Water Use Information
Service Area
| Sub-Basin(s) | % of Service Population |
|---|
| New River (02-6) | 42 % |
| Cape Fear River (02-3) | 41 % |
| Northeast Cape Fear River (02-5) | 17 % |
|
| County(s) | % of Service Population |
|---|
| New Hanover | 100 % |
|
Water Use by Type
| Type of Use |
Metered
Connections |
Metered
Average Use (MGD) |
Non-Metered
Connections |
Non-Metered
Estimated Use (MGD) |
| Residential |
76,500 |
12.0300 |
81 |
0.0000 |
| Commercial |
5,425 |
4.0300 |
483 |
0.0000 |
| Industrial |
180 |
0.1400 |
24 |
0.0000 |
| Institutional |
803 |
1.6600 |
73 |
0.0000 |
How much water was used for system processes (backwash, line cleaning, flushing, etc.)? 1.2258 MGD
Use in above table does not include amount for purchase systems. Unmetered connections represent fire lines. MGD totals exclude amounts for customers reported individually. Water Sales
| Purchaser |
PWSID |
Average
Daily Sold
(MGD) |
Days
Used |
Contract |
Required to
comply with water
use restrictions? |
Pipe Size(s)
(Inches) |
Use
Type |
| MGD |
Expiration |
Recurring |
| Oyster Point S/D |
04-65-211 |
0.0058 |
366 |
|
|
|
Yes |
6 |
Regular |
| Port of Wilmington |
70-65-007 |
0.0965 |
366 |
|
|
|
Yes |
12 |
Regular |
| Wilmington Clinic Water System |
70-65-070 |
0.0111 |
366 |
|
|
|
Yes |
3 |
Regular |
| Wrightsville Beach |
04-65-020 |
0.4079 |
366 |
1.1520 |
2025 |
Yes |
Yes |
8 |
Regular |
ILA with Wrightsville Beach states that the Authority will furnish the Town up to 150 MG per year beginning calendar year 2022 and recurring each subsequent year the bulk agreement is renewed. The maximum rate at which the Authority will deliver water through the connection point shall not exceed 800 gpm. 3. Water Supply Sources
Monthly Withdrawals & Purchases
|
Average Daily
Use (MGD) |
Max Day
Use (MGD) |
|
Average Daily
Use (MGD) |
Max Day
Use (MGD) |
|
Average Daily
Use (MGD) |
Max Day
Use (MGD) |
| Jan |
20.5707 |
23.3350 |
May |
24.9023 |
27.9990 |
Sep |
25.4529 |
28.2350 |
| Feb |
20.4837 |
21.3130 |
Jun |
27.9170 |
32.2140 |
Oct |
25.8056 |
27.2090 |
| Mar |
20.6858 |
22.3390 |
Jul |
27.3194 |
29.9500 |
Nov |
22.8946 |
26.7070 |
| Apr |
23.6567 |
26.5000 |
Aug |
24.9531 |
28.8420 |
Dec |
21.2474 |
23.6120 |

Ground Water Sources
| Name or Number |
Average Daily Withdrawal (MGD) |
Max Day Withdrawal (MGD) |
12-Hour Supply
(MGD) |
CUA Reduction |
Year Offline |
Use Type |
| MGD |
Days Used |
| #15 NHC |
0.1062 |
22 |
0.313 |
0.4320 |
|
|
Emergency |
| #16 NHC/PD-Q |
0.3622 |
343 |
1.045 |
0.4320 |
|
|
Regular |
| #19 NHC |
0.1196 |
22 |
0.355 |
0.2160 |
|
|
Emergency |
| #20 NHC |
0.0369 |
14 |
0.122 |
0.2230 |
|
|
Emergency |
| #22 NHC/PD-B |
0.6030 |
336 |
0.782 |
0.4320 |
|
|
Regular |
| #23 NHC/PD-A |
0.3476 |
345 |
0.993 |
0.4320 |
|
|
Regular |
| #28 NHC/PD-M |
0.1852 |
350 |
0.542 |
0.2880 |
|
|
Regular |
| #29 NHC/PD-N |
0.1681 |
251 |
0.368 |
0.2880 |
|
|
Regular |
| #30 NHC/PD-O |
0.1854 |
353 |
0.699 |
0.2880 |
|
|
Regular |
| #31 City (Queens Point) |
0.0000 |
0 |
0 |
0.2170 |
|
|
Emergency |
| #34 City (Sea Spray) |
0.0000 |
0 |
0 |
0.6740 |
|
|
Emergency |
| #38 City (Foxcroft) |
0.0332 |
12 |
0.051 |
0.3030 |
|
|
Emergency |
| #4 NHC |
0.0339 |
14 |
0.173 |
0.2770 |
|
|
Emergency |
| #40 City (Pirates Cove) |
0.0281 |
12 |
0.068 |
0.2420 |
|
|
Emergency |
| #43 City (Masonboro Forest) |
0.0461 |
11 |
0.093 |
0.1880 |
|
|
Emergency |
| #44 City (Sea Pines) |
0.0000 |
0 |
0 |
0.5400 |
|
|
Emergency |
| #45 City (Beacon Woods) |
0.0181 |
12 |
0.038 |
0.1330 |
|
|
Emergency |
| #5 NHC |
0.0145 |
4 |
0.022 |
0.2680 |
|
|
Emergency |
| #8 NHC/PD-P |
0.1784 |
342 |
0.456 |
0.2520 |
|
|
Regular |
| CH-B |
0.0000 |
0 |
0 |
0.2880 |
|
|
Regular |
| CH-C |
0.0756 |
21 |
0.303 |
0.2880 |
|
|
Regular |
| CH-F |
0.1724 |
360 |
0.496 |
0.3420 |
|
|
Regular |
| CH-G |
0.1596 |
357 |
0.377 |
0.2520 |
|
|
Regular |
| CH-H |
0.1600 |
327 |
0.376 |
0.2520 |
|
|
Regular |
| CH-I |
0.0424 |
27 |
0.159 |
0.2880 |
|
|
Regular |
| CH-J |
0.0847 |
235 |
0.295 |
0.2520 |
|
|
Regular |
| CH-K |
0.0305 |
159 |
0.145 |
0.1080 |
|
|
Regular |
| CH-L |
0.1942 |
350 |
0.624 |
0.3420 |
|
|
Regular |
| Monterey Heights #1 |
0.1132 |
366 |
0.196 |
0.0940 |
|
|
Regular |
| Monterey Heights #2 |
0.1465 |
366 |
0.249 |
0.1800 |
|
|
Regular |
| Monterey Heights #3 |
0.1644 |
356 |
0.312 |
0.2304 |
|
|
Regular |
| Monterey Heights #4 |
0.2348 |
366 |
0.414 |
0.1510 |
|
|
Regular |
| Monterey Heights #5 |
0.1300 |
366 |
0.225 |
0.1690 |
|
|
Regular |
| Monterey Heights #6 |
0.1142 |
256 |
0.219 |
0.1584 |
|
|
Regular |
| Monterey Heights #7 |
0.0576 |
69 |
0.124 |
0.1584 |
|
|
Regular |
| PD-C |
0.2142 |
363 |
0.512 |
0.2880 |
|
|
Regular |
| PD-F |
0.2458 |
362 |
0.704 |
0.3420 |
|
|
Regular |
| PD-G |
0.2233 |
357 |
0.496 |
0.2520 |
|
|
Regular |
| PD-H |
0.1649 |
331 |
0.333 |
0.3240 |
|
|
Regular |
| PD-I |
0.2351 |
317 |
0.555 |
0.2880 |
|
|
Regular |
| PD-J |
0.2052 |
279 |
0.430 |
0.2520 |
|
|
Regular |
| PD-K |
0.2097 |
346 |
0.482 |
0.2880 |
|
|
Regular |
| PD-L |
0.2481 |
354 |
0.809 |
0.2880 |
|
|
Regular |
Ground Water Sources (continued)
| Name or Number |
Well Depth (Feet) |
Casing Depth
(Feet) |
Screen Depth (Feet) |
Well Diameter (Inches) |
Pump Intake Depth (Feet) |
Metered? |
| Top |
Bottom |
| #15 NHC |
185 |
140 |
|
|
12 |
105 |
Yes |
| #16 NHC/PD-Q |
175 |
|
|
|
12 |
105 |
Yes |
| #19 NHC |
|
|
|
|
|
|
Yes |
| #20 NHC |
170 |
123 |
|
|
12 |
|
Yes |
| #22 NHC/PD-B |
170 |
133 |
|
|
14 |
123 |
Yes |
| #23 NHC/PD-A |
170 |
133 |
|
|
14 |
|
Yes |
| #28 NHC/PD-M |
175 |
140 |
|
|
14 |
80 |
Yes |
| #29 NHC/PD-N |
175 |
140 |
|
|
14 |
80 |
Yes |
| #30 NHC/PD-O |
171 |
137 |
131 |
169 |
14 |
123 |
Yes |
| #31 City (Queens Point) |
155 |
126 |
|
|
8 |
|
Yes |
| #34 City (Sea Spray) |
165 |
|
|
|
12 |
|
Yes |
| #38 City (Foxcroft) |
160 |
126 |
|
|
8 |
|
Yes |
| #4 NHC |
145 |
125 |
|
|
12 |
65 |
Yes |
| #40 City (Pirates Cove) |
165 |
128 |
|
|
8 |
|
Yes |
| #43 City (Masonboro Forest) |
|
|
|
|
|
|
Yes |
| #44 City (Sea Pines) |
190 |
|
|
|
12 |
|
Yes |
| #45 City (Beacon Woods) |
|
|
|
|
|
|
Yes |
| #5 NHC |
157 |
122 |
|
|
12 |
|
Yes |
| #8 NHC/PD-P |
160 |
132 |
|
|
12 |
90 |
Yes |
| CH-B |
80 |
50 |
42 |
82 |
14 |
60 |
Yes |
| CH-C |
100 |
47 |
49 |
89 |
14 |
60 |
Yes |
| CH-F |
105 |
47 |
52 |
92 |
14 |
60 |
Yes |
| CH-G |
90 |
48 |
46 |
86 |
14 |
60 |
Yes |
| CH-H |
100 |
45 |
50 |
90 |
14 |
60 |
Yes |
| CH-I |
95 |
49 |
44 |
84 |
14 |
60 |
Yes |
| CH-J |
100 |
46 |
52 |
92 |
14 |
60 |
Yes |
| CH-K |
92 |
54 |
52 |
92 |
14 |
60 |
Yes |
| CH-L |
80 |
50 |
52 |
72 |
14 |
60 |
Yes |
| Monterey Heights #1 |
136 |
114 |
|
|
8 |
94 |
Yes |
| Monterey Heights #2 |
156 |
91 |
91 |
156 |
10 |
88 |
Yes |
| Monterey Heights #3 |
132 |
88 |
82 |
132 |
12 |
80 |
Yes |
| Monterey Heights #4 |
190 |
|
|
|
8 |
120 |
Yes |
| Monterey Heights #5 |
125 |
105 |
|
|
8 |
100 |
Yes |
| Monterey Heights #6 |
140 |
139 |
|
|
6 |
129 |
Yes |
| Monterey Heights #7 |
177 |
174 |
|
|
6 |
150 |
Yes |
| PD-C |
168 |
137 |
|
|
14 |
80 |
Yes |
| PD-F |
170 |
137 |
|
|
14 |
80 |
Yes |
| PD-G |
169 |
136 |
134 |
167 |
14 |
122 |
Yes |
| PD-H |
165 |
137 |
128 |
163 |
14 |
123 |
Yes |
| PD-I |
175 |
148 |
|
|
14 |
80 |
Yes |
| PD-J |
177 |
143 |
139 |
175 |
14 |
128 |
Yes |
| PD-K |
175 |
135 |
|
|
14 |
80 |
Yes |
| PD-L |
175 |
135 |
|
|
14 |
80 |
Yes |
Surface Water Sources
| Stream |
Reservoir |
Average Daily Withdrawal |
Maximum Day
Withdrawal (MGD) |
Available Raw
Water Supply |
Usable On-Stream
Raw Water Supply
Storage (MG) |
| MGD |
Days Used |
MGD |
* Qualifier |
| Cape Fear River - Kings Bluff |
|
8.3674 |
256 |
9.8290 |
10.0000 |
F |
0.0000 |
* Qualifier: C=Contract Amount, SY20=20-year Safe Yield, SY50=50-year Safe Yield, F=20% of 7Q10 or other instream flow requirement, CUA=Capacity Use Area Permit
Surface Water Sources (continued)
| Stream |
Reservoir |
Drainage Area
(sq mi) |
Metered? |
Sub-Basin |
County |
Year
Offline |
Use
Type |
| Cape Fear River - Kings Bluff |
|
5,255 |
Yes |
Cape Fear River (02-3) |
Bladen |
|
Regular |
Withdrawals from the Cape Fear River are from CFPUA intake at Kings Bluff Pump Station. Raw water purchased from the Lower Cape Fear Water and Sewer Authority is captured under Water Supply Sources, purchase. Water Purchases From Other Systems
| Seller |
PWSID |
Average
Daily Purchased
(MGD) |
Days
Used |
Contract |
Required to
comply with water
use restrictions? |
Pipe Size(s)
(Inches) |
Use
Type |
| MGD |
Expiration |
Recurring |
| LCFWASA - Kings Bluff |
50-09-013 |
11.7491 |
366 |
38.0000 |
2022 |
Yes |
Yes |
48,54 |
Regular |
Max day purchase was 21.1120 MGD Water Treatment Plants
| Plant Name |
Permitted Capacity
(MGD) |
Is Raw Water Metered? |
Is Finished Water Ouput Metered? |
Source |
| Richardson Nano-Filtration Mem |
7.0000 |
Yes |
Yes |
GW from Castle Hayne & PeeDee Aquifers |
| Sweeney Water Treatment Plant |
44.0000 |
Yes |
Yes |
Cape Fear River |
4. Wastewater Information
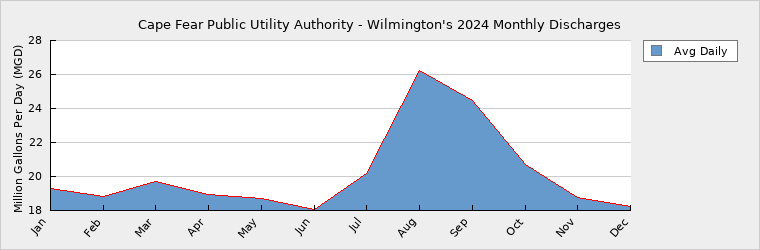
Monthly Discharges
|
Average Daily
Discharge (MGD) |
|
Average Daily
Discharge (MGD) |
|
Average Daily
Discharge (MGD) |
| Jan |
19.2861 |
May |
18.7212 |
Sep |
24.4953 |
| Feb |
18.8484 |
Jun |
18.0483 |
Oct |
20.6964 |
| Mar |
19.7224 |
Jul |
20.1499 |
Nov |
18.7427 |
| Apr |
18.9614 |
Aug |
26.2274 |
Dec |
18.2113 |
The Southside Wastewater Treatment Plant (Permit # NC0023973) is currently undergoing a design-build replacement/expansion project to increase total treatment capacity to 16 MGD, upgrade the headworks, modernize treatment processes, and ensure capacity for foreseeable future growth within its service area(s). Wastewater Permits
| Permit Number |
Type |
Permitted Capacity
(MGD) |
Design Capacity
(MGD) |
Average Annual
Daily Discharge
(MGD) |
Maximum Day Discharge
(MGD) |
Receiving Stream |
Receiving Basin |
| NC0002879 |
WTP |
44.0000 |
44.0000 |
0.5000 |
2.5000 |
Cape Fear River |
Cape Fear River (02-3) |
| NC0023965 |
WWTP |
16.0000 |
16.0000 |
10.9000 |
33.1000 |
Cape Fear River |
Cape Fear River (02-3) |
| NC0023973 |
WWTP |
12.0000 |
12.0000 |
7.8000 |
21.5000 |
Cape Fear River |
Cape Fear River (02-3) |
| NC0088307 |
WTP |
7.0000 |
7.0000 |
1.0000 |
2.1000 |
Intracoastal Waterway |
White Oak River (17-1) |
Wastewater Interconnections
| Water System |
PWSID |
Type |
Average Daily Amount |
Contract
Maximum (MGD) |
| MGD |
Days Used |
| Pender County Utilities |
70-71-011 |
Receiving |
0.0360 |
366 |
|
| Wrightsville Beach |
04-65-020 |
Receiving |
0.6248 |
366 |
1.5000 |
5. Planning
Projections
| |
2024 |
2030 |
2040 |
2050 |
2060 |
2070 |
| Year-Round Population |
246,684 |
261,376 |
293,439 |
349,055 |
369,845 |
415,213 |
| Seasonal Population |
0 |
0 |
0 |
0 |
0 |
0 |
| |
| Residential |
12.0300 |
13.2800 |
17.3200 |
24.1100 |
27.0600 |
30.3900 |
| Commercial |
4.0300 |
4.4500 |
5.8000 |
8.0800 |
9.0700 |
10.1800 |
| Industrial |
0.1400 |
0.1500 |
0.2000 |
0.2800 |
0.3100 |
0.3500 |
| Institutional |
1.6600 |
1.8300 |
2.3900 |
3.3300 |
3.7300 |
4.1900 |
| System Process |
1.2258 |
3.0400 |
3.9600 |
5.5200 |
6.1900 |
6.9500 |
| Unaccounted-for |
3.0985 |
1.5967 |
2.0823 |
2.9000 |
3.2537 |
3.6537 |
Future Supply Sources
| Source Name |
PWSID |
Source Type |
Additional Supply |
Year Online |
Year Offline |
Type |
| Well Field Expansion |
04-65-010 |
Ground |
4.6080 |
2030 |
|
Regular |
An expansion of the well field supplying the Richardson WTP as well as a WTP expansion in production capacity is planned in the 10-year CFPUA CIP. Demand v/s Percent of Supply
| |
2024 |
2030 |
2040 |
2050 |
2060 |
2070 |
| Surface Water Supply |
10.0000 |
10.0000 |
10.0000 |
10.0000 |
10.0000 |
10.0000 |
| Ground Water Supply |
8.2872 |
8.2872 |
8.2872 |
8.2872 |
8.2872 |
8.2872 |
| Purchases |
38.0000 |
38.0000 |
38.0000 |
38.0000 |
38.0000 |
38.0000 |
| Future Supplies |
4.6080 |
4.6080 |
4.6080 |
4.6080 |
4.6080 |
| Total Available Supply (MGD) |
56.2872 |
60.8952 |
60.8952 |
60.8952 |
60.8952 |
60.8952 |
| Service Area Demand |
22.1843 |
24.3467 |
31.7523 |
44.2200 |
49.6137 |
55.7137 |
| Sales |
0.5213 |
1.2654 |
1.2654 |
1.2654 |
1.2654 |
1.2654 |
| Future Sales |
0.0000 |
0.0000 |
0.0000 |
0.0000 |
0.0000 |
| Total Demand (MGD) |
22.7056 |
25.6121 |
33.0177 |
45.4854 |
50.8791 |
56.9791 |
| Demand as Percent of Supply |
40% |
42% |
54% |
75% |
84% |
94% |

The purpose of the above chart is to show a general indication of how the long-term per capita water demand changes over time. The per capita water demand may actually be different than indicated due to seasonal populations and the accuracy of data submitted. Water systems that have calculated long-term per capita water demand based on a methodology that produces different results may submit their information in the notes field.
Your long-term water demand is 49 gallons per capita per day. What demand management practices do you plan to implement to reduce the per capita water demand (i.e. conduct regular water audits, implement a plumbing retrofit program, employ practices such as rainwater harvesting or reclaimed water)? If these practices are covered elsewhere in your plan, indicate where the practices are discussed here.
CFPUA continues to conduct annual water loss audits and investigate system optimization strategies.
Are there other demand management practices you will implement to reduce your future supply needs? CFPUA's Water System Master Plan update is underway via our engineering department and seeks to address future needs as identified to meet customer demand projections.
What supplies other than the ones listed in future supplies are being considered to meet your future supply needs? Optimization of existing groundwater emergency wells in key system support areas. Master planning for both upgrading and adding production wells to provide additional capacity to the Richardson WTP and overall integrated system. Extensive interconnects allow the integrated system to be supported by all supply sources in a more reliable and resilient manner. The Lower Cape Fear Water and Sewer Authority as well as purchase partners (Brunswick, Pender, CFPUA, commercial) are investing resources into redundancy and resiliency along the length of the common raw water transmission mains which are underway this calendar year (2025).
How does the water system intend to implement the demand management and supply planning components above? Funding and design of additional sources will be through CFPUA's Capital Improvements Plan as required to meet anticipated demands. The demand-to-supply ration in the Lower Cape Fear Water and Sewer Authority (LCFWASA) - Kings Bluff Local Water Supply Plan (LWSP) is currently above 80% because available raw water supply is fully allocated to the existing customers and partners (i.e. Brunswick County, CFPUA, and Pender County). Based on a 7Q10 calculation, the total available supply for the LCFWASA system is 106 MGD at Lock & Dam No. 1. Even so, the currently projected demands of all partners - when totaled - remains below the 80% of the available raw water supply for the foreseeable future (i.e. 2050). Furthermore, all the partners have agreed not to exceed the demands currently projected in their LWSP, without notice to NCDWR, even though these amounts may remain less than what LCFWASA - Kings Bluff is obligated to sell them. However, should projected water demands of the partners increase to such amounts where the demand-to-supply ratio in the LCFWASA Kings Bluff LWSP exceeds 80%, a long-term water supply plan to address future demands would be necessary, per statutory requirements, before NCDWR could approve the LWSP.
Additional Information
Has this system participated in regional water supply or water use planning? Yes, In 2020, CFPUA, LCFWASA, Brunswick, and Pender Counties implemented a Raw Water Supply Emergency Management Plan to have a unified protocol for water shortage response planning and reporting during droughts, water emergencies, and other potential raw water supply challenges.
What major water supply reports or studies were used for planning? Each partner utilized their existing water shortage and emergency response plans to create a unified plan.
Please describe any other needs or issues regarding your water supply sources, any water system deficiencies or needed improvements (storage, treatment, etc.) or your ability to meet present and future water needs. Include both quantity and quality considerations, as well as financial, technical, managerial, permitting, and compliance issues:
The Division of Water Resources (DWR) provides the data contained within this
Local Water Supply Plan (LWSP) as a courtesy and service to our customers.
DWR staff does not field verify data. Neither DWR, nor any other party
involved in the preparation of this LWSP attests that the data is completely
free of errors and omissions. Furthermore, data users are cautioned that
LWSPs labeled PROVISIONAL have yet to be reviewed by DWR staff. Subsequent
review may result in significant revision. Questions regarding the accuracy
or limitations of usage of this data should be directed to the water system
and/or DWR.
|