|
The Division of Water Resources (DWR) provides the data contained within this
Local Water Supply Plan (LWSP) as a courtesy and service to our customers.
DWR staff does not field verify data. Neither DWR, nor any other party
involved in the preparation of this LWSP attests that the data is completely
free of errors and omissions. Furthermore, data users are cautioned that
LWSPs labeled PROVISIONAL have yet to be reviewed by DWR staff. Subsequent
review may result in significant revision. Questions regarding the accuracy
or limitations of usage of this data should be directed to the water system
and/or DWR.
1. System Information
Contact Information
Complete
| Water System Name: |
Seaboard |
|
PWSID: |
04-66-035 |
| Mailing Address: | P.O. Box 327
Seaboard, NC 27876 | Ownership: | Municipality |
| |
| Contact Person: | Jeffrey Long | Title: | ORC |
| Phone: | 252-308-2984 | Cell/Mobile: | -- |
| |
| Secondary Contact: | Mike Houston | | Phone: | 919-812-6088 |
| Mailing Address: |
, NC 28525 | Cell/Mobile: | -- |
Distribution System
| Line Type |
Size Range (Inches) |
Estimated % of lines |
| Ductile Iron |
2-8 |
40.00 % |
| Polyvinyl Chloride |
2-8 |
60.00 % |
Programs
Seaboard uses NCRWA as needed for leak detection. Water Conservation
2. Water Use Information
Service Area
| Sub-Basin(s) | % of Service Population |
|---|
| Meherrin River (04-2) | 100 % |
|
| County(s) | % of Service Population |
|---|
| Northampton | 100 % |
|
Water Use by Type
| Type of Use |
Metered
Connections |
Metered
Average Use (MGD) |
Non-Metered
Connections |
Non-Metered
Estimated Use (MGD) |
| Residential |
309 |
0.0281 |
0 |
0.0000 |
| Commercial |
0 |
0.0000 |
0 |
0.0000 |
| Industrial |
2 |
0.0147 |
0 |
0.0000 |
| Institutional |
0 |
0.0000 |
0 |
0.0000 |
How much water was used for system processes (backwash, line cleaning, flushing, etc.)? 0.0050 MGD
Metered average use increased from last year due to new water meter replacement. The 6'' meter at the lumber mill was also replaced with a new meter early 2024. Commerical accounts are now being rolled into the residential user type column. Water Sales
| Purchaser |
PWSID |
Average
Daily Sold
(MGD) |
Days
Used |
Contract |
Required to
comply with water
use restrictions? |
Pipe Size(s)
(Inches) |
Use
Type |
| MGD |
Expiration |
Recurring |
| Northampton Co - Progressive |
04-66-045 |
0.0000 |
0 |
0.0000 |
2100 |
Yes |
Yes |
8 |
Emergency |
3. Water Supply Sources
Monthly Withdrawals & Purchases
|
Average Daily
Use (MGD) |
Max Day
Use (MGD) |
|
Average Daily
Use (MGD) |
Max Day
Use (MGD) |
|
Average Daily
Use (MGD) |
Max Day
Use (MGD) |
| Jan |
0.0381 |
|
May |
0.0572 |
|
Sep |
0.0633 |
|
| Feb |
0.0574 |
|
Jun |
0.0592 |
|
Oct |
0.0548 |
|
| Mar |
0.0565 |
|
Jul |
0.0573 |
|
Nov |
0.0500 |
|
| Apr |
0.0598 |
|
Aug |
0.0662 |
|
Dec |
0.0548 |
|

Ground Water Sources
| Name or Number |
Average Daily Withdrawal (MGD) |
Max Day Withdrawal (MGD) |
12-Hour Supply
(MGD) |
CUA Reduction |
Year Offline |
Use Type |
| MGD |
Days Used |
| Well #1 |
0.0586 |
330 |
|
0.0962 |
|
|
Regular |
| Well #2 |
0.0434 |
28 |
|
0.1464 |
|
|
Regular |
Ground Water Sources (continued)
| Name or Number |
Well Depth (Feet) |
Casing Depth
(Feet) |
Screen Depth (Feet) |
Well Diameter (Inches) |
Pump Intake Depth (Feet) |
Metered? |
| Top |
Bottom |
| Well #1 |
210 |
115 |
65 |
115 |
8 |
115 |
Yes |
| Well #2 |
|
|
|
|
|
|
Yes |
Water Purchases From Other Systems
| Seller |
PWSID |
Average
Daily Purchased
(MGD) |
Days
Used |
Contract |
Required to
comply with water
use restrictions? |
Pipe Size(s)
(Inches) |
Use
Type |
| MGD |
Expiration |
Recurring |
| Northampton Co - Progressive |
04-66-045 |
0.0000 |
0 |
0.0000 |
2100 |
Yes |
Yes |
8 |
Emergency |
4. Wastewater Information
Monthly Discharges
|
Average Daily
Discharge (MGD) |
|
Average Daily
Discharge (MGD) |
|
Average Daily
Discharge (MGD) |
| Jan |
0.0057 |
May |
0.0044 |
Sep |
0.0113 |
| Feb |
0.0092 |
Jun |
0.0251 |
Oct |
0.0119 |
| Mar |
0.0177 |
Jul |
0.0236 |
Nov |
0.0060 |
| Apr |
0.0174 |
Aug |
0.0171 |
Dec |
0.0070 |
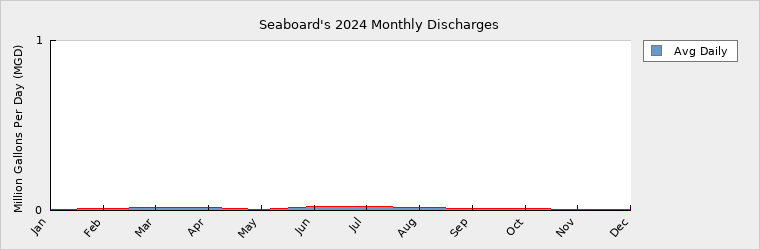
The discharge totals do not compare with previous years as they are considerably lower. The numbers for 2024 are coming directly off of our monthly reports whereas in the past we suspect this data was being estimated due to faulty meters or inaccurate information. Wastewater Permits
| Permit Number |
Type |
Permitted Capacity
(MGD) |
Design Capacity
(MGD) |
Average Annual
Daily Discharge
(MGD) |
Maximum Day Discharge
(MGD) |
Receiving Stream |
Receiving Basin |
| WQ0003299 |
CS |
0.1360 |
0.1360 |
0.0130 |
|
Land Application |
Meherrin River (04-2) |
5. Planning
Projections
| |
2024 |
2030 |
2040 |
2050 |
2060 |
2070 |
| Year-Round Population |
881 |
879 |
877 |
874 |
872 |
870 |
| Seasonal Population |
0 |
0 |
0 |
0 |
0 |
0 |
| |
| Residential |
0.0281 |
0.0280 |
0.0279 |
0.0278 |
0.0277 |
0.0276 |
| Commercial |
0.0000 |
0.0000 |
0.0000 |
0.0000 |
0.0000 |
0.0000 |
| Industrial |
0.0147 |
0.0147 |
0.0147 |
0.0147 |
0.0147 |
0.0147 |
| Institutional |
0.0000 |
0.0000 |
0.0000 |
0.0000 |
0.0000 |
0.0000 |
| System Process |
0.0050 |
0.0049 |
0.0048 |
0.0047 |
0.0046 |
0.0045 |
| Unaccounted-for |
0.0084 |
0.0084 |
0.0083 |
0.0083 |
0.0083 |
0.0082 |
Demand v/s Percent of Supply
| |
2024 |
2030 |
2040 |
2050 |
2060 |
2070 |
| Surface Water Supply |
0.0000 |
0.0000 |
0.0000 |
0.0000 |
0.0000 |
0.0000 |
| Ground Water Supply |
0.2426 |
0.2426 |
0.2426 |
0.2426 |
0.2426 |
0.2426 |
| Purchases |
0.0000 |
0.0000 |
0.0000 |
0.0000 |
0.0000 |
0.0000 |
| Future Supplies |
0.0000 |
0.0000 |
0.0000 |
0.0000 |
0.0000 |
| Total Available Supply (MGD) |
0.2426 |
0.2426 |
0.2426 |
0.2426 |
0.2426 |
0.2426 |
| Service Area Demand |
0.0562 |
0.0560 |
0.0557 |
0.0555 |
0.0553 |
0.0550 |
| Sales |
0.0000 |
0.0000 |
0.0000 |
0.0000 |
0.0000 |
0.0000 |
| Future Sales |
0.0000 |
0.0000 |
0.0000 |
0.0000 |
0.0000 |
| Total Demand (MGD) |
0.0562 |
0.0560 |
0.0557 |
0.0555 |
0.0553 |
0.0550 |
| Demand as Percent of Supply |
23% |
23% |
23% |
23% |
23% |
23% |

The purpose of the above chart is to show a general indication of how the long-term per capita water demand changes over time. The per capita water demand may actually be different than indicated due to seasonal populations and the accuracy of data submitted. Water systems that have calculated long-term per capita water demand based on a methodology that produces different results may submit their information in the notes field.
Your long-term water demand is 32 gallons per capita per day. What demand management practices do you plan to implement to reduce the per capita water demand (i.e. conduct regular water audits, implement a plumbing retrofit program, employ practices such as rainwater harvesting or reclaimed water)? If these practices are covered elsewhere in your plan, indicate where the practices are discussed here.
No Changes
Are there other demand management practices you will implement to reduce your future supply needs? No Changes
What supplies other than the ones listed in future supplies are being considered to meet your future supply needs? No Changes
How does the water system intend to implement the demand management and supply planning components above? No Changes
Additional Information
Has this system participated in regional water supply or water use planning? No
What major water supply reports or studies were used for planning? N/A
Please describe any other needs or issues regarding your water supply sources, any water system deficiencies or needed improvements (storage, treatment, etc.) or your ability to meet present and future water needs. Include both quantity and quality considerations, as well as financial, technical, managerial, permitting, and compliance issues: Seaboard has experienced increasing iron levels in our raw water for some time now. The iron in our raw water has caused color / staining inside our elevated storage tank and throughout the entire distribution system. Our water treatment facility was originally designed to perform iron removal and water softening, however our filters / media are not performing as needed. The overall aesthetics and water quality have diminished over the years and continues to worsen over time.
Some of our water meters are over fifty years in age. We are open to all financially feasible options regarding a complete meter replacement project. New meters would help increase our revenues, provide more accurate billing, and potentially aid in customer leak detection. As opposed to standard manual read meters, we feel AMR / AMI meters would better serve our town and customers and allow us to become more efficient and provide better customer service.
In addition to the before-mentioned concerns, our raw water production wells are also in need of rehabilitation as the screens need to be cleaned to improve overall efficiency and pump capacities.
Due to limited customer base and increasing operating cost we feel that financial assistance will be needed in order to help address the wide array of water quality, treatment, and operational issues moving forward.
The Division of Water Resources (DWR) provides the data contained within this
Local Water Supply Plan (LWSP) as a courtesy and service to our customers.
DWR staff does not field verify data. Neither DWR, nor any other party
involved in the preparation of this LWSP attests that the data is completely
free of errors and omissions. Furthermore, data users are cautioned that
LWSPs labeled PROVISIONAL have yet to be reviewed by DWR staff. Subsequent
review may result in significant revision. Questions regarding the accuracy
or limitations of usage of this data should be directed to the water system
and/or DWR.
|