|
The Division of Water Resources (DWR) provides the data contained within this
Local Water Supply Plan (LWSP) as a courtesy and service to our customers.
DWR staff does not field verify data. Neither DWR, nor any other party
involved in the preparation of this LWSP attests that the data is completely
free of errors and omissions. Furthermore, data users are cautioned that
LWSPs labeled PROVISIONAL have yet to be reviewed by DWR staff. Subsequent
review may result in significant revision. Questions regarding the accuracy
or limitations of usage of this data should be directed to the water system
and/or DWR.
1. System Information
Contact Information
Incomplete
| Water System Name: |
Northampton Co - Progressive |
|
PWSID: |
04-66-045 |
| Mailing Address: | P.O Box 68
Jackson, NC 27845 | Ownership: | County |
| |
| Contact Person: | Becky Turner | Title: | Public Works Director |
| Phone: | 252-534-6341 | Cell/Mobile: | 252-578-5506 |
| |
| Secondary Contact: | Mike Houston | | Phone: | -- |
| Mailing Address: |
, NC 28525 | Cell/Mobile: | 919-812-6088 |
Distribution System
| Line Type |
Size Range (Inches) |
Estimated % of lines |
| Asbestos Cement |
6-8 |
20.00 % |
| Ductile Iron |
6-12 |
10.00 % |
| Polyvinyl Chloride |
2-12 |
70.00 % |
Programs
Water Conservation
2. Water Use Information
Service Area
| Sub-Basin(s) | % of Service Population |
|---|
| Roanoke River (14-1) | 0 % |
|
| County(s) | % of Service Population |
|---|
| Northampton | 0 % |
|
Water Use by Type
| Type of Use |
Metered
Connections |
Metered
Average Use (MGD) |
Non-Metered
Connections |
Non-Metered
Estimated Use (MGD) |
| Residential |
620 |
0.1500 |
0 |
0.0000 |
| Commercial |
10 |
0.0170 |
1 |
0.0010 |
| Industrial |
0 |
0.0000 |
0 |
0.0000 |
| Institutional |
0 |
0.0000 |
0 |
0.0000 |
How much water was used for system processes (backwash, line cleaning, flushing, etc.)? 0.0000 MGD
Commercial, Industrial, & Institutional are all classified as Commercial. Based on this report, the amount of raw water is less than the finished water metered. Northampton-Progressive needs to look at our instrumentation to see if there is a calibration problem. Without knowing what is wrong adjustments to the water use numbers cannot be made at this time. Water Sales
| Purchaser |
PWSID |
Average
Daily Sold
(MGD) |
Days
Used |
Contract |
Required to
comply with water
use restrictions? |
Pipe Size(s)
(Inches) |
Use
Type |
| MGD |
Expiration |
Recurring |
| Northampton Co- Gaston |
04-66-113 |
0.0000 |
0 |
0.0000 |
|
|
|
12 |
Emergency |
3. Water Supply Sources
Monthly Withdrawals & Purchases
|
Average Daily
Use (MGD) |
Max Day
Use (MGD) |
|
Average Daily
Use (MGD) |
Max Day
Use (MGD) |
|
Average Daily
Use (MGD) |
Max Day
Use (MGD) |
| Jan |
0.1720 |
0.1850 |
May |
0.1800 |
0.1940 |
Sep |
0.1590 |
0.1880 |
| Feb |
0.1690 |
0.1840 |
Jun |
0.1750 |
0.2140 |
Oct |
0.1520 |
0.1740 |
| Mar |
0.1780 |
0.1980 |
Jul |
0.1720 |
0.1900 |
Nov |
0.1710 |
0.1830 |
| Apr |
0.1790 |
0.1890 |
Aug |
0.1680 |
0.1860 |
Dec |
0.1670 |
0.1970 |
Northampton-Progressive needs to look at our instrumentation to see if there is a calibration problem. Without knowing what is wrong adjustments to the water use numbers cannot be made at this time. 
Ground Water Sources
| Name or Number |
Average Daily Withdrawal (MGD) |
Max Day Withdrawal (MGD) |
12-Hour Supply
(MGD) |
CUA Reduction |
Year Offline |
Use Type |
| MGD |
Days Used |
| 1 |
0.0000 |
0 |
0.000 |
0.0000 |
|
1993 |
Regular |
| 2 |
0.0480 |
363 |
0.069 |
0.0200 |
|
2005 |
Regular |
| 3 |
0.0560 |
337 |
0.079 |
0.0260 |
|
2005 |
Regular |
Ground Water Sources (continued)
| Name or Number |
Well Depth (Feet) |
Casing Depth
(Feet) |
Screen Depth (Feet) |
Well Diameter (Inches) |
Pump Intake Depth (Feet) |
Metered? |
| Top |
Bottom |
| 1 |
0 |
0 |
0 |
0 |
0 |
0 |
No |
| 2 |
0 |
0 |
0 |
0 |
6 |
0 |
Yes |
| 3 |
0 |
0 |
0 |
0 |
6 |
0 |
Yes |
Wells 2 & 3 are chlorinated at the wells. Well 1 offline due to benzene contamination. Well casing, screen depth, and pump intake depths are unknown. Northampton-Progressive needs to look at our instrumentation to see if there is a calibration problem. Without knowing what is wrong adjustments to the water use numbers cannot be made at this time. Water Purchases From Other Systems
| Seller |
PWSID |
Average
Daily Purchased
(MGD) |
Days
Used |
Contract |
Required to
comply with water
use restrictions? |
Pipe Size(s)
(Inches) |
Use
Type |
| MGD |
Expiration |
Recurring |
| Northampton Co- Gaston |
04-66-113 |
0.0000 |
0 |
0.0000 |
|
|
|
12 |
Emergency |
| Weldon |
04-42-020 |
0.0660 |
365 |
0.1000 |
|
|
|
6 |
Regular |
Weldon contract has yearly extension as long as there are no changes to the agreement. Northampton-Progressive needs to look at our instrumentation to see if there is a calibration problem. Without knowing what is wrong adjustments to the water use numbers cannot be made at this time. 4. Wastewater Information
Monthly Discharges
|
Average Daily
Discharge (MGD) |
|
Average Daily
Discharge (MGD) |
|
Average Daily
Discharge (MGD) |
| Jan |
0.1290 |
May |
0.1290 |
Sep |
0.1290 |
| Feb |
0.1290 |
Jun |
0.1290 |
Oct |
0.1290 |
| Mar |
0.1290 |
Jul |
0.1290 |
Nov |
0.1290 |
| Apr |
0.1290 |
Aug |
0.1290 |
Dec |
0.1290 |
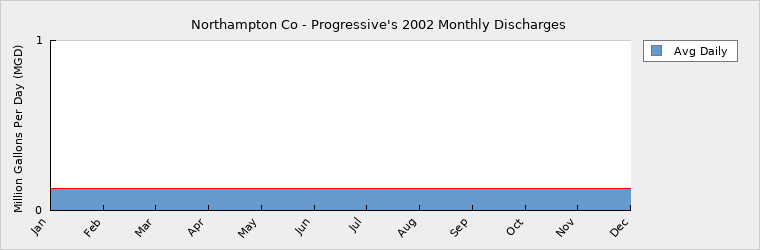
Weldon bills a standard rate for discharge. Current meter is broken and is being replaced. Average daily water discharge determined from information provided from Weldon 2002 LWSP. Wastewater Interconnections
| Water System |
PWSID |
Type |
Average Daily Amount |
Contract
Maximum (MGD) |
| MGD |
Days Used |
| Weldon |
04-42-020 |
Discharging |
0.1290 |
365 |
0.0000 |
5. Planning
Projections
| |
2002 |
2010 |
2020 |
2030 |
| Year-Round Population |
1,511 |
1,600 |
1,700 |
1,800 |
| Seasonal Population |
0 |
0 |
0 |
0 |
| |
| Residential |
0.1500 |
0.1900 |
0.2000 |
0.2100 |
| Commercial |
0.0180 |
0.0100 |
0.0100 |
0.0150 |
| Industrial |
0.0000 |
0.0000 |
0.0000 |
0.0000 |
| Institutional |
0.0000 |
0.0030 |
0.0030 |
0.0030 |
| System Process |
0.0000 |
0.0000 |
0.0000 |
0.0000 |
| Unaccounted-for |
-0.0026 |
0.0030 |
0.0030 |
0.0030 |
Anticipate slow and gradual population increase. Northampton-Progressive's average daily water demands exceed 80% Demand as Percent of Supply. As of this time, a specific plan to address the supply deficiency has not been submitted. Demand v/s Percent of Supply
| |
2002 |
2010 |
2020 |
2030 |
| Surface Water Supply |
0.0000 |
0.0000 |
0.0000 |
0.0000 |
| Ground Water Supply |
0.0460 |
0.0000 |
0.0000 |
0.0000 |
| Purchases |
0.1000 |
0.1000 |
0.1000 |
0.1000 |
| Future Supplies |
0.0000 |
0.0000 |
0.0000 |
| Total Available Supply (MGD) |
0.1460 |
0.1000 |
0.1000 |
0.1000 |
| Service Area Demand |
0.1654 |
0.2060 |
0.2160 |
0.2310 |
| Sales |
0.0000 |
0.0000 |
0.0000 |
0.0000 |
| Future Sales |
0.0000 |
0.0000 |
0.0000 |
| Total Demand (MGD) |
0.1654 |
0.2060 |
0.2160 |
0.2310 |
| Demand as Percent of Supply |
113% |
206% |
216% |
231% |

The purpose of the above chart is to show a general indication of how the long-term per capita water demand changes over time. The per capita water demand may actually be different than indicated due to seasonal populations and the accuracy of data submitted. Water systems that have calculated long-term per capita water demand based on a methodology that produces different results may submit their information in the notes field.
Your long-term water demand is 99 gallons per capita per day. What demand management practices do you plan to implement to reduce the per capita water demand (i.e. conduct regular water audits, implement a plumbing retrofit program, employ practices such as rainwater harvesting or reclaimed water)? If these practices are covered elsewhere in your plan, indicate where the practices are discussed here.
Are there other demand management practices you will implement to reduce your future supply needs?
What supplies other than the ones listed in future supplies are being considered to meet your future supply needs?
How does the water system intend to implement the demand management and supply planning components above?
Beginning in 2003, the wells were shut down and Northampton - Progressive converted supply to solely a purchase system. Northampton-Progressive's average daily water demands exceed 80% Demand as Percent of Supply. As of this time, a specific plan to address the supply deficiency has not been submitted. Additional Information
Has this system participated in regional water supply or water use planning? No
What major water supply reports or studies were used for planning? NA
Please describe any other needs or issues regarding your water supply sources, any water system deficiencies or needed improvements (storage, treatment, etc.) or your ability to meet present and future water needs. Include both quantity and quality considerations, as well as financial, technical, managerial, permitting, and compliance issues:
The Division of Water Resources (DWR) provides the data contained within this
Local Water Supply Plan (LWSP) as a courtesy and service to our customers.
DWR staff does not field verify data. Neither DWR, nor any other party
involved in the preparation of this LWSP attests that the data is completely
free of errors and omissions. Furthermore, data users are cautioned that
LWSPs labeled PROVISIONAL have yet to be reviewed by DWR staff. Subsequent
review may result in significant revision. Questions regarding the accuracy
or limitations of usage of this data should be directed to the water system
and/or DWR.
|