|
The Division of Water Resources (DWR) provides the data contained within this
Local Water Supply Plan (LWSP) as a courtesy and service to our customers.
DWR staff does not field verify data. Neither DWR, nor any other party
involved in the preparation of this LWSP attests that the data is completely
free of errors and omissions. Furthermore, data users are cautioned that
LWSPs labeled PROVISIONAL have yet to be reviewed by DWR staff. Subsequent
review may result in significant revision. Questions regarding the accuracy
or limitations of usage of this data should be directed to the water system
and/or DWR.
1. System Information
Contact Information
Provisional
| Water System Name: |
ONWASA |
|
PWSID: |
04-67-035 |
| Mailing Address: | 228 Georgetown Road
Jacksonville, NC 28540 | Ownership: | Authority |
| |
| Contact Person: | Seth Brown | Title: | Treatment Facilities Administrator |
| Phone: | 910-937-7520 | Cell/Mobile: | -- |
| |
| Secondary Contact: | Matthew Padgett | | Phone: | 910-937-7529 |
| Mailing Address: | 228 Georgetown Rd.
Jacksonville, NC 28540 | Cell/Mobile: | -- |
Distribution System
| Line Type |
Size Range (Inches) |
Estimated % of lines |
| Asbestos Cement |
4-6 |
1.00 % |
| Ductile Iron |
4-24 |
10.00 % |
| Galvanized Iron |
2 |
2.00 % |
| Polyvinyl Chloride |
2-18 |
87.00 % |
Programs
Water Conservation
2. Water Use Information
Service Area
| Sub-Basin(s) | % of Service Population |
|---|
| New River (02-6) | 64 % |
| White Oak River (17-1) | 34 % |
| Northeast Cape Fear River (02-5) | 2 % |
|
| County(s) | % of Service Population |
|---|
| Onslow | 100 % |
|
Water Use by Type
| Type of Use |
Metered
Connections |
Metered
Average Use (MGD) |
Non-Metered
Connections |
Non-Metered
Estimated Use (MGD) |
| Residential |
54,342 |
7.3224 |
0 |
0.0000 |
| Commercial |
1,622 |
0.4817 |
0 |
0.0000 |
| Industrial |
12 |
0.0413 |
0 |
0.0000 |
| Institutional |
48 |
0.0788 |
0 |
0.0000 |
How much water was used for system processes (backwash, line cleaning, flushing, etc.)? 1.3340 MGD
Water Sales
| Purchaser |
PWSID |
Average
Daily Sold
(MGD) |
Days
Used |
Contract |
Required to
comply with water
use restrictions? |
Pipe Size(s)
(Inches) |
Use
Type |
| MGD |
Expiration |
Recurring |
| City of Jacksonville |
04-67-010 |
0.0000 |
0 |
|
|
No |
No |
6-10 |
Emergency |
| Pender County Utilities |
70-71-011 |
0.0096 |
365 |
0.0600 |
2029 |
Yes |
No |
6 |
Regular |
| Scientific Water and Sewer |
04-67-222 |
0.0097 |
366 |
|
|
Yes |
Yes |
6 |
Regular |
| Scientific Water and Sewer |
04-67-223 |
0.0000 |
0 |
|
|
Yes |
Yes |
6 |
Emergency |
| Scientific Water And Sewer |
04-67-224 |
0.0095 |
366 |
|
|
Yes |
Yes |
6 |
Regular |
| Scientific Water And Sewer |
04-67-221 |
0.0000 |
0 |
0.0000 |
|
Yes |
Yes |
6 |
Emergency |
| Scientific Water And Sewer |
04-67-228 |
0.0000 |
0 |
|
|
Yes |
Yes |
6 |
Emergency |
| USMC Camp Lejeune |
04-67-556 |
0.0177 |
366 |
|
|
Yes |
Yes |
8 |
Regular |
| USMC Camp Lejeune (Rifle Range) |
04-67-046 |
0.3256 |
366 |
0.5900 |
2060 |
Yes |
Yes |
8 |
Regular |
ONWASA provided water service to two small subdivisions in the City of Jacksonville (0.0727 MGD). This demand should be accounted for in ONWASA's residential demand since these customers are on their distribution system. 3. Water Supply Sources
Monthly Withdrawals & Purchases
|
Average Daily
Use (MGD) |
Max Day
Use (MGD) |
|
Average Daily
Use (MGD) |
Max Day
Use (MGD) |
|
Average Daily
Use (MGD) |
Max Day
Use (MGD) |
| Jan |
11.1255 |
13.2354 |
May |
11.5651 |
13.3704 |
Sep |
11.1792 |
13.2968 |
| Feb |
9.8781 |
11.7176 |
Jun |
13.5818 |
17.0239 |
Oct |
10.8559 |
12.0406 |
| Mar |
9.9523 |
11.4410 |
Jul |
12.4045 |
14.8686 |
Nov |
10.4473 |
12.0604 |
| Apr |
10.9860 |
12.1558 |
Aug |
11.7935 |
14.0160 |
Dec |
10.7430 |
12.3490 |

Ground Water Sources
| Name or Number |
Average Daily Withdrawal (MGD) |
Max Day Withdrawal (MGD) |
12-Hour Supply
(MGD) |
CUA Reduction |
Year Offline |
Use Type |
| MGD |
Days Used |
| 1 |
0.4431 |
326 |
1.2770 |
0.4680 |
CUA25 |
|
Regular |
| 10 |
0.2435 |
159 |
0.7390 |
0.4680 |
CUA25 |
|
Regular |
| 11 |
0.3102 |
162 |
0.9830 |
0.4680 |
CUA25 |
|
Regular |
| 12 |
0.3729 |
296 |
0.9610 |
0.4680 |
CUA25 |
|
Regular |
| 13 |
0.1770 |
321 |
0.4450 |
0.2980 |
CUA0 |
|
Regular |
| 14 |
0.0000 |
0 |
|
0.0970 |
CUA0 |
2008 |
Emergency |
| 2 |
0.3176 |
328 |
0.7310 |
0.4680 |
CUA25 |
|
Regular |
| 4 |
0.5614 |
332 |
1.1940 |
0.4500 |
CUA25 |
|
Regular |
| 5 |
0.1977 |
211 |
0.7460 |
0.4500 |
CUA25 |
|
Regular |
| 6 |
0.3374 |
300 |
0.8760 |
0.4212 |
CUA25 |
|
Regular |
| 7 |
0.0000 |
0 |
|
0.2160 |
CUA25 |
2019 |
Emergency |
| 7R |
0.0000 |
0 |
|
0.2160 |
CUA25 |
|
Emergency |
| 8 |
0.3062 |
293 |
0.7680 |
0.3780 |
CUA25 |
|
Regular |
| 9 |
0.1694 |
95 |
0.5640 |
0.4680 |
CUA25 |
|
Regular |
| D1 |
0.7086 |
256 |
1.6750 |
0.7200 |
CUA0 |
|
Regular |
| D10 |
0.6310 |
240 |
1.8830 |
1.0044 |
CUA0 |
|
Regular |
| D11 |
0.5808 |
237 |
1.4750 |
0.7200 |
CUA0 |
|
Regular |
| D12 |
0.0000 |
0 |
|
0.8640 |
CUA0 |
|
Regular |
| D2 |
0.4705 |
232 |
1.1440 |
0.5400 |
CUA0 |
|
Regular |
| D3 |
0.0636 |
248 |
0.1700 |
0.1800 |
CUA0 |
|
Regular |
| D4R |
0.0000 |
0 |
|
0.8640 |
CUA0 |
|
Regular |
| D5 |
0.6298 |
264 |
1.6510 |
0.9360 |
CUA0 |
|
Regular |
| D6 |
0.6405 |
309 |
1.5040 |
0.6120 |
CUA0 |
|
Regular |
| D7 |
0.7796 |
321 |
1.9680 |
0.5400 |
CUA0 |
|
Regular |
| D8 |
0.2781 |
270 |
0.8583 |
0.3600 |
CUA0 |
|
Regular |
| D9 |
0.0878 |
177 |
0.3136 |
0.1332 |
CUA0 |
|
Regular |
| H1 |
0.5816 |
174 |
1.0670 |
0.6120 |
CUA0 |
|
Regular |
| H10 |
0.3116 |
327 |
0.7150 |
0.4788 |
CUA0 |
|
Regular |
| H11 |
0.4536 |
328 |
1.1760 |
0.5364 |
CUA0 |
|
Regular |
| H12 |
0.3516 |
312 |
0.8050 |
0.3456 |
CUA0 |
|
Regular |
| H13 |
0.2824 |
323 |
0.6020 |
0.3240 |
CUA0 |
|
Regular |
| H14 |
0.2829 |
327 |
0.6470 |
0.3240 |
CUA0 |
|
Regular |
| H15 |
0.2148 |
293 |
0.5450 |
0.3622 |
CUA0 |
|
Regular |
| H2 |
0.7325 |
330 |
1.5390 |
0.7200 |
CUA0 |
|
Regular |
| H3 |
0.2931 |
246 |
0.7710 |
0.3960 |
CUA0 |
|
Regular |
| H4 |
0.2263 |
328 |
0.6040 |
0.5040 |
CUA0 |
|
Regular |
| H6 |
0.2588 |
326 |
0.6060 |
0.2520 |
CUA0 |
|
Regular |
| H7 |
0.3351 |
329 |
0.7750 |
0.4824 |
CUA0 |
|
Regular |
| H8 |
0.5158 |
327 |
1.0900 |
0.6660 |
CUA0 |
|
Regular |
| H9 |
0.2209 |
321 |
0.4810 |
0.2520 |
CUA0 |
|
Regular |
| R1 |
0.0000 |
0 |
|
0.0000 |
CUA0 |
|
Emergency |
| R2 |
0.0000 |
0 |
|
0.1656 |
CUA25 |
|
Emergency |
| R3 |
0.0000 |
0 |
|
0.0000 |
CUA0 |
|
Emergency |
| UC1-Beaufort |
0.0000 |
0 |
|
0.2880 |
CUA0 |
|
Emergency |
| UC1-LCH |
0.0000 |
0 |
|
0.2880 |
CUA0 |
|
Emergency |
| UC2 |
0.0000 |
0 |
|
0.2880 |
CUA0 |
|
Emergency |
Ground Water Sources (continued)
| Name or Number |
Well Depth (Feet) |
Casing Depth
(Feet) |
Screen Depth (Feet) |
Well Diameter (Inches) |
Pump Intake Depth (Feet) |
Metered? |
| Top |
Bottom |
| 1 |
587 |
|
477 |
582 |
8 |
389 |
Yes |
| 10 |
615 |
|
530 |
610 |
10 |
442 |
Yes |
| 11 |
607 |
|
510 |
602 |
10 |
382 |
Yes |
| 12 |
633 |
|
477 |
628 |
12 |
420 |
Yes |
| 13 |
500 |
|
202 |
495 |
10 |
304 |
Yes |
| 14 |
535 |
|
270 |
530 |
8 |
340 |
No |
| 2 |
630 |
|
495 |
625 |
8 |
399 |
Yes |
| 4 |
665 |
|
560 |
660 |
8 |
384 |
Yes |
| 5 |
645 |
|
490 |
640 |
8 |
389 |
Yes |
| 6 |
610 |
|
505 |
605 |
8 |
399 |
Yes |
| 7 |
656 |
|
535 |
651 |
8 |
378 |
No |
| 7R |
572 |
|
522 |
562 |
12 |
500 |
No |
| 8 |
635 |
|
530 |
630 |
10 |
411 |
Yes |
| 9 |
637 |
|
477 |
631 |
12 |
391 |
Yes |
| D1 |
196 |
|
175 |
196 |
20 |
132 |
Yes |
| D10 |
172 |
|
112 |
172 |
18 |
97 |
Yes |
| D11 |
166 |
|
106 |
166 |
18 |
95 |
Yes |
| D12 |
193 |
|
100 |
183 |
24 |
90 |
Yes |
| D2 |
202 |
|
159 |
202 |
20 |
142 |
Yes |
| D3 |
207 |
|
173 |
202 |
12 |
168 |
Yes |
| D4R |
190 |
|
98 |
180 |
24 |
88 |
Yes |
| D5 |
215 |
|
170 |
215 |
20 |
142 |
Yes |
| D6 |
195 |
|
158 |
195 |
20 |
137 |
Yes |
| D7 |
194 |
|
157 |
194 |
20 |
138 |
Yes |
| D8 |
255 |
|
190 |
250 |
12 |
205 |
Yes |
| D9 |
125 |
|
80 |
120 |
12 |
89 |
Yes |
| H1 |
240 |
|
201 |
240 |
20 |
122 |
Yes |
| H10 |
136 |
|
106 |
126 |
20 |
91 |
Yes |
| H11 |
190 |
|
165 |
185 |
20 |
146 |
Yes |
| H12 |
152 |
|
134 |
152 |
20 |
128 |
Yes |
| H13 |
195 |
|
166 |
190 |
10 |
160 |
Yes |
| H14 |
213 |
|
178 |
213 |
20 |
155 |
Yes |
| H15 |
160 |
|
108 |
155 |
10 |
105 |
Yes |
| H2 |
196 |
|
123 |
196 |
20 |
80 |
Yes |
| H3 |
130 |
|
101 |
130 |
12 |
82 |
Yes |
| H4 |
131 |
|
101 |
131 |
12 |
92 |
Yes |
| H6 |
165 |
|
104 |
155 |
20 |
89 |
Yes |
| H7 |
182 |
|
152 |
172 |
20 |
127 |
Yes |
| H8 |
174 |
|
152 |
174 |
20 |
132 |
Yes |
| H9 |
265 |
|
235 |
255 |
20 |
187 |
Yes |
| R1 |
200 |
|
|
|
|
|
No |
| R2 |
525 |
|
500 |
525 |
10 |
280 |
Yes |
| R3 |
525 |
|
0 |
0 |
0 |
0 |
Yes |
| UC1-Beaufort |
210 |
|
170 |
210 |
8 |
165 |
Yes |
| UC1-LCH |
112 |
|
77 |
112 |
8 |
72 |
Yes |
| UC2 |
90 |
|
50 |
80 |
20 |
63 |
Yes |
Water Purchases From Other Systems
| Seller |
PWSID |
Average
Daily Purchased
(MGD) |
Days
Used |
Contract |
Required to
comply with water
use restrictions? |
Pipe Size(s)
(Inches) |
Use
Type |
| MGD |
Expiration |
Recurring |
| Camp Lejeune (New River Air Station) |
04-67-042 |
0.4070 |
64 |
1.2500 |
2060 |
Yes |
No |
12 |
Regular |
| City of Jacksonville |
04-67-010 |
0.0000 |
0 |
0.0000 |
|
Yes |
Yes |
6-10 |
Emergency |
| Northwest Water Association |
04-67-038 |
0.0000 |
0 |
0.0000 |
|
No |
Yes |
4 |
Emergency |
| Town of Surf City |
04-71-015 |
0.1760 |
365 |
0.2500 |
|
Yes |
Yes |
8 |
Regular |
Water Treatment Plants
| Plant Name |
Permitted Capacity
(MGD) |
Is Raw Water Metered? |
Is Finished Water Ouput Metered? |
Source |
| Black Creek 1 |
0.4680 |
No |
Yes |
1 |
| Black Creek 10 |
0.4680 |
No |
Yes |
10 |
| Black Creek 11 |
0.4680 |
No |
Yes |
11 |
| Black Creek 12 |
0.4680 |
No |
Yes |
12 |
| Black Creek 13 |
0.2980 |
No |
Yes |
13 |
| Black Creek 2 |
0.4680 |
No |
Yes |
2 |
| Black Creek 4 |
0.4680 |
No |
Yes |
4 |
| Black Creek 5 |
0.4500 |
No |
Yes |
5 |
| Black Creek 6 |
0.4210 |
No |
Yes |
6 |
| Black Creek 8 |
0.3780 |
No |
Yes |
8 |
| Black Creek 9 |
0.4680 |
No |
Yes |
9 |
| Dixon Water Treatment Plant |
4.0000 |
Yes |
Yes |
Dixon Well s 1,2,3,5,6,7,8,9,10,11 |
| Hubert Water Treatment Plant |
6.0000 |
Yes |
Yes |
Hubert Wells 1,2,3,4,6,7,8,9,10,11,12,13,14,15 |
| R2 |
0.1650 |
No |
Yes |
R2 |
4. Wastewater Information
Monthly Discharges
|
Average Daily
Discharge (MGD) |
|
Average Daily
Discharge (MGD) |
|
Average Daily
Discharge (MGD) |
| Jan |
3.3857 |
May |
3.4126 |
Sep |
3.4151 |
| Feb |
3.2453 |
Jun |
3.4336 |
Oct |
3.2657 |
| Mar |
3.3459 |
Jul |
3.3694 |
Nov |
3.3218 |
| Apr |
3.3673 |
Aug |
3.4064 |
Dec |
3.4048 |
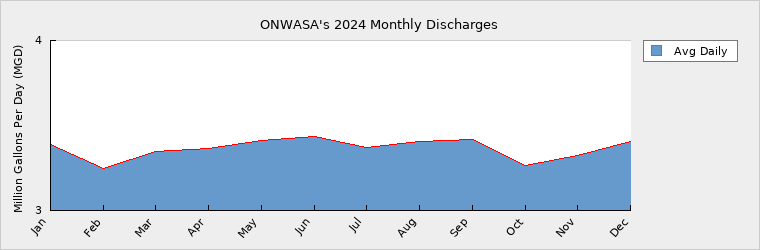
Currently the Summer House WWTP is under expansion from 0.181 MGD to 0.400 MGD, as well as the North Topsail WWTP to expand from 1.5 MGD to 3.0 MGD.
THE MONTHLY DISCHARGE NUMBERS WERE ADJUSTED BASED ON WASTEWATER DATA SUBMITTED TO THE STATE AND AVERAGE ANNUAL DISCHARGE NUMBERS. Wastewater Permits
| Permit Number |
Type |
Permitted Capacity
(MGD) |
Design Capacity
(MGD) |
Average Annual
Daily Discharge
(MGD) |
Maximum Day Discharge
(MGD) |
Receiving Stream |
Receiving Basin |
| NC0034991 |
WWTP |
0.0260 |
0.0260 |
0.0000 |
|
Little Northeast Creek |
New River (02-6) |
| NC0083321 |
WTP |
0.3000 |
2.9200 |
0.3450 |
|
Queens Creek |
New River (02-6) |
| NC0083551 |
WTP |
1.0000 |
2.7450 |
0.2600 |
|
none |
New River (02-6) |
| NC0089877 |
WWTP |
0.3500 |
0.3500 |
0.2360 |
|
Wallace Creek |
White Oak River (17-1) |
| WQ0005849 |
WWTP |
1.5426 |
1.5426 |
0.8320 |
|
None |
New River (02-6) |
| WQ0019907 |
WTP |
0.2420 |
0.2420 |
0.2120 |
|
none |
New River (02-6) |
| WQ0023261 |
WWTP |
0.6000 |
0.6000 |
0.4570 |
|
none |
White Oak River (17-1) |
| WQ0029945 |
WWTP |
0.1800 |
0.4000 |
0.0580 |
|
none |
New River (02-6) |
| WQ0034367 |
WWTP |
1.2730 |
2.0000 |
0.4340 |
|
none |
New River (02-6) |
Wastewater Interconnections
| Water System |
PWSID |
Type |
Average Daily Amount |
Contract
Maximum (MGD) |
| MGD |
Days Used |
| Camp Lejeune (Holcome Blvd.) |
04-67-043 |
Discharging |
0.4240 |
366 |
3.5000 |
| City of Jacksonville |
04-67-010 |
Discharging |
0.1065 |
366 |
|
5. Planning
Projections
| |
2024 |
2030 |
2040 |
2050 |
2060 |
2070 |
| Year-Round Population |
156,755 |
162,241 |
186,578 |
214,564 |
246,749 |
283,761 |
| Seasonal Population |
0 |
0 |
0 |
0 |
0 |
0 |
| |
| Residential |
7.3224 |
7.5790 |
8.7150 |
10.0230 |
11.5260 |
13.2550 |
| Commercial |
0.4817 |
0.4990 |
0.5730 |
0.6590 |
0.7580 |
0.8720 |
| Industrial |
0.0413 |
0.0430 |
0.0490 |
0.0570 |
0.0650 |
0.0750 |
| Institutional |
0.0788 |
0.0820 |
0.0940 |
0.1080 |
0.1240 |
0.1430 |
| System Process |
1.3340 |
1.3810 |
1.5880 |
1.8260 |
2.1000 |
2.4150 |
| Unaccounted-for |
0.9193 |
0.8760 |
1.0080 |
1.1590 |
1.3330 |
1.5330 |
Future Water Sales
| Purchaser |
PWSID |
Contract |
Pipe Size(s) (Inches) |
Use Type |
| MGD |
Year Begin |
Year End |
| Camp Lejeune (Holcomb Blvd) |
04-67-043 |
0.5000 |
2025 |
|
6 |
Regular |
Future Supply Sources
| Source Name |
PWSID |
Source Type |
Additional Supply |
Year Online |
Year Offline |
Type |
| Castle Hayne |
04-67-035 |
Ground |
6.0000 |
2010 |
|
Regular |
Two new production wells were drilled in 2024 capable of producing 2.0 MGD each, to serve the Dixon WTP. The Dixon WTP is under design to increase capacity from 4.0 MGD to 6.0 MGD. ONWASA is also conducting site assessments and process design for a third water treatment plant in the northwest portion of Onslow County, as well as assessing the potential for use of a surface water source (dewatering discharge from an adjacent quarry operation) to feed this facility in addition to existing wells. Currently exploring additional water sources for the Hubert WTP as well.
Demand v/s Percent of Supply
| |
2024 |
2030 |
2040 |
2050 |
2060 |
2070 |
| Surface Water Supply |
0.0000 |
0.0000 |
0.0000 |
0.0000 |
0.0000 |
0.0000 |
| Ground Water Supply |
17.1553 |
17.1553 |
17.1553 |
17.1553 |
17.1553 |
17.1553 |
| Purchases |
1.5000 |
1.5000 |
1.5000 |
1.5000 |
1.5000 |
1.5000 |
| Future Supplies |
6.0000 |
6.0000 |
6.0000 |
6.0000 |
6.0000 |
| Total Available Supply (MGD) |
18.6553 |
24.6553 |
24.6553 |
24.6553 |
24.6553 |
24.6553 |
| Service Area Demand |
10.1775 |
10.4600 |
12.0270 |
13.8320 |
15.9060 |
18.2930 |
| Sales |
0.3721 |
0.6869 |
0.6869 |
0.6869 |
0.6869 |
0.6869 |
| Future Sales |
0.5000 |
0.5000 |
0.5000 |
0.5000 |
0.5000 |
| Total Demand (MGD) |
10.5496 |
11.6469 |
13.2139 |
15.0189 |
17.0929 |
19.4799 |
| Demand as Percent of Supply |
57% |
47% |
54% |
61% |
69% |
79% |

The purpose of the above chart is to show a general indication of how the long-term per capita water demand changes over time. The per capita water demand may actually be different than indicated due to seasonal populations and the accuracy of data submitted. Water systems that have calculated long-term per capita water demand based on a methodology that produces different results may submit their information in the notes field.
Your long-term water demand is 47 gallons per capita per day. What demand management practices do you plan to implement to reduce the per capita water demand (i.e. conduct regular water audits, implement a plumbing retrofit program, employ practices such as rainwater harvesting or reclaimed water)? If these practices are covered elsewhere in your plan, indicate where the practices are discussed here.
No Change
Are there other demand management practices you will implement to reduce your future supply needs? While not strictly a demand management approach, ONWASA has implemented a leak detection program in conjunction with AMI in a effort to reduce our unaccounted water loss.
What supplies other than the ones listed in future supplies are being considered to meet your future supply needs? ONWASA continues its discussion with the operators of a local quarry about the potential for capturing discharge from dewatering activities to supply a planned third treatment plant in the northwestern portion of surface water source (dewatering discharge from an adjacent quarry operation) to feed this facility in addition to existing wells. Additionally design of a third water plant has started in the central area of our system.
How does the water system intend to implement the demand management and supply planning components above? Through funding from ONWASA's existing capital improvement plan and standing contracts with professional services consulting firms who specialize in these types of activities. We are also soliciting federal/state infrastructure grants applicable to this work.
Additional Information
Has this system participated in regional water supply or water use planning? Yes, Yes, Yes, The three primary potable water providers in Onslow County (ONWASA, the City of Jacksonville and Marine Corps Base Camp Lejeune) form the Onslow Regional Water Resources Group (ORWRG). Through the efforts of its members, the ORWRG has created a network of groundwater monitoring wells to provide data on the capacity and quality of the source water aquifers all three entities use. It is also a vehicle to share information on each system's activities, anticipated demand and future improvements.
What major water supply reports or studies were used for planning? A Hydro-Stratigraphic Framework Study (completed in 2014) provided a better understanding of the nature and distribution of groundwater resources within Onslow County, and has guided groundwater monitoring well efforts. The firm that prepared that document also advises the ORWRG.
Please describe any other needs or issues regarding your water supply sources, any water system deficiencies or needed improvements (storage, treatment, etc.) or your ability to meet present and future water needs. Include both quantity and quality considerations, as well as financial, technical, managerial, permitting, and compliance issues: Efforts are underway in three major areas: securing new raw water sources, increasing treatment capacity and improving the existing distribution system so water can be efficiently moved to the areas it is needed. Construction of a third water treatment plant and securing the raw water sources to feed it are the primary water system focus at the present time, and the cost to complete this work (estimated at $150M) will have a major impact on the current capital improvement plan. ONWASA is also working to address sewage treatment capacity issues in our Swansboro and Southeast collection systems, and that puts additional pressure on our CIP funding.
The Division of Water Resources (DWR) provides the data contained within this
Local Water Supply Plan (LWSP) as a courtesy and service to our customers.
DWR staff does not field verify data. Neither DWR, nor any other party
involved in the preparation of this LWSP attests that the data is completely
free of errors and omissions. Furthermore, data users are cautioned that
LWSPs labeled PROVISIONAL have yet to be reviewed by DWR staff. Subsequent
review may result in significant revision. Questions regarding the accuracy
or limitations of usage of this data should be directed to the water system
and/or DWR.
|