|
The Division of Water Resources (DWR) provides the data contained within this
Local Water Supply Plan (LWSP) as a courtesy and service to our customers.
DWR staff does not field verify data. Neither DWR, nor any other party
involved in the preparation of this LWSP attests that the data is completely
free of errors and omissions. Furthermore, data users are cautioned that
LWSPs labeled PROVISIONAL have yet to be reviewed by DWR staff. Subsequent
review may result in significant revision. Questions regarding the accuracy
or limitations of usage of this data should be directed to the water system
and/or DWR.
1. System Information
Contact Information
Incomplete
| Water System Name: |
Elizabeth City |
|
PWSID: |
04-70-010 |
| Mailing Address: | PO Box 347
Elizabeth City, NC 27909 | Ownership: | Municipality |
| |
| Contact Person: | Gregory Colvin | Title: | Water Treatment Plant Supt. |
| Phone: | 252-337-6647 | Cell/Mobile: | 252-333-2540 |
| |
| Secondary Contact: | Dwan Bell | | Phone: | 252-337-6628 |
| Mailing Address: | PO Box 347
Elizabeth City, NC 27907-0347 | Cell/Mobile: | 252-333-2540 |
Distribution System
| Line Type |
Size Range (Inches) |
Estimated % of lines |
| Asbestos Cement |
6-8 |
8.00 % |
| Cast Iron |
4-12 |
32.00 % |
| Ductile Iron |
4-20 |
20.00 % |
| Galvanized Iron |
2 |
20.00 % |
| Polyvinyl Chloride |
4-12 |
20.00 % |
Programs
Water Conservation
2. Water Use Information
Service Area
| Sub-Basin(s) | % of Service Population |
|---|
| Albemarle Sound (12-1) | 0 % |
|
| County(s) | % of Service Population |
|---|
| Pasquotank | 0 % |
|
Water Use by Type
| Type of Use |
Metered
Connections |
Metered
Average Use (MGD) |
Non-Metered
Connections |
Non-Metered
Estimated Use (MGD) |
| Residential |
6,235 |
0.7370 |
0 |
0.0000 |
| Commercial |
882 |
0.3430 |
0 |
0.0000 |
| Industrial |
20 |
0.0390 |
0 |
0.0000 |
| Institutional |
101 |
0.3370 |
0 |
0.0000 |
How much water was used for system processes (backwash, line cleaning, flushing, etc.)? 0.1650 MGD
After initial review of plan and further discussion it appears the error between monthly-metered water connections and the amount of water withdrawn and purchased is due to the unknown well withdrawal amounts. Water Sales
| Purchaser |
PWSID |
Average
Daily Sold
(MGD) |
Days
Used |
Contract |
Required to
comply with water
use restrictions? |
Pipe Size(s)
(Inches) |
Use
Type |
| MGD |
Expiration |
Recurring |
| Pasquotank Co |
04-70-015 |
0.0230 |
365 |
0.0000 |
|
|
|
8 |
Regular |
| S Camden WSD |
04-15-015 |
0.2800 |
243 |
0.0000 |
|
|
|
10 |
Regular |
No water sales to South Camden WSD after Ocotober 2002-their own supply system came on-line. 3. Water Supply Sources
Monthly Withdrawals & Purchases
|
Average Daily
Use (MGD) |
Max Day
Use (MGD) |
|
Average Daily
Use (MGD) |
Max Day
Use (MGD) |
|
Average Daily
Use (MGD) |
Max Day
Use (MGD) |
| Jan |
2.1000 |
2.4000 |
May |
2.2000 |
2.5000 |
Sep |
2.1000 |
2.5000 |
| Feb |
2.1000 |
2.3000 |
Jun |
2.2000 |
2.6000 |
Oct |
2.2000 |
2.5000 |
| Mar |
2.2000 |
2.4000 |
Jul |
2.1000 |
2.5000 |
Nov |
2.1000 |
2.4000 |
| Apr |
2.2000 |
2.5000 |
Aug |
2.2000 |
2.6000 |
Dec |
2.2000 |
2.3000 |
After initial review of plan and further discussion it appears the error between monthly-metered water connections and the amount of water withdrawn and purchased is due to the unknown well withdrawal amounts. 
Ground Water Sources
| Name or Number |
Average Daily Withdrawal (MGD) |
Max Day Withdrawal (MGD) |
12-Hour Supply
(MGD) |
CUA Reduction |
Year Offline |
Use Type |
| MGD |
Days Used |
| 01 |
0.5040 |
8 |
0.504 |
0.2520 |
|
|
Regular |
| 02 |
0.2880 |
342 |
0.288 |
0.1440 |
|
|
Regular |
| 03 |
0.5760 |
277 |
0.576 |
0.2880 |
|
|
Regular |
| 04 |
0.5400 |
365 |
0.540 |
0.2700 |
|
|
Regular |
| 05 A |
0.0720 |
125 |
0.072 |
0.0360 |
|
|
Regular |
| 06 |
0.1440 |
40 |
0.144 |
0.0720 |
|
|
Regular |
| 07 |
0.1580 |
127 |
0.158 |
0.0790 |
|
|
Regular |
| 08 |
0.5760 |
365 |
0.576 |
0.2880 |
|
|
Regular |
| 09 |
0.2880 |
285 |
0.288 |
0.1440 |
|
|
Regular |
| 10 |
0.5400 |
96 |
0.540 |
0.2700 |
|
|
Regular |
| 11 |
0.1580 |
134 |
0.158 |
0.0790 |
|
|
Regular |
Ground Water Sources (continued)
| Name or Number |
Well Depth (Feet) |
Casing Depth
(Feet) |
Screen Depth (Feet) |
Well Diameter (Inches) |
Pump Intake Depth (Feet) |
Metered? |
| Top |
Bottom |
| 01 |
117 |
60 |
98 |
101 |
6 |
65 |
No |
| 02 |
113 |
65 |
57 |
87 |
8 |
65 |
No |
| 03 |
125 |
60 |
94 |
120 |
10 |
93 |
No |
| 04 |
140 |
80 |
94 |
119 |
10 |
35 |
No |
| 05 A |
103 |
103 |
78 |
98 |
8 |
56 |
No |
| 06 |
87 |
53 |
77 |
87 |
6 |
80 |
No |
| 07 |
94 |
28 |
56 |
66 |
6 |
44 |
No |
| 08 |
126 |
115 |
90 |
110 |
8 |
44 |
No |
| 09 |
117 |
112 |
97 |
107 |
8 |
47 |
No |
| 10 |
130 |
115 |
85 |
110 |
8 |
58 |
No |
| 11 |
126 |
111 |
50 |
65 |
8 |
63 |
No |
Average daily withdrawal and maximum day withdrawal amounts unavailable in 2002. After initial review of plan and further discussion it appears the error between monthly-metered water connections and the amount of water withdrawn and purchased is due to the unknown well withdrawal amounts. Water Purchases From Other Systems
| Seller |
PWSID |
Average
Daily Purchased
(MGD) |
Days
Used |
Contract |
Required to
comply with water
use restrictions? |
Pipe Size(s)
(Inches) |
Use
Type |
| MGD |
Expiration |
Recurring |
| Pasquotank Co |
04-70-015 |
0.0110 |
365 |
0.5000 |
|
|
|
8 |
Regular |
After initial review of plan and further discussion it appears the error between monthly-metered water connections and the amount of water withdrawn and purchased is due to the unknown well withdrawal amounts. Water Treatment Plants
| Plant Name |
Permitted Capacity
(MGD) |
Is Raw Water Metered? |
Is Finished Water Ouput Metered? |
Source |
| Elizabeth City WTP |
5.0000 |
Yes |
No |
Groundwater |
4. Wastewater Information
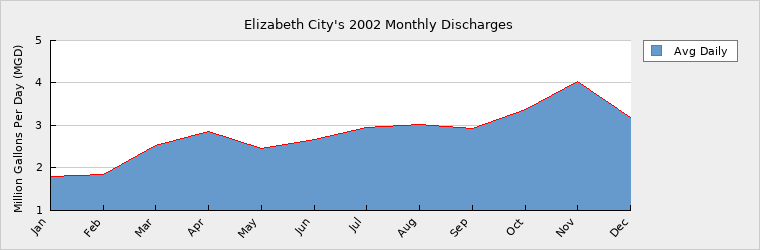
Monthly Discharges
|
Average Daily
Discharge (MGD) |
|
Average Daily
Discharge (MGD) |
|
Average Daily
Discharge (MGD) |
| Jan |
1.7940 |
May |
2.4660 |
Sep |
2.9180 |
| Feb |
1.8410 |
Jun |
2.6740 |
Oct |
3.3700 |
| Mar |
2.5310 |
Jul |
2.9520 |
Nov |
4.0290 |
| Apr |
2.8510 |
Aug |
3.0350 |
Dec |
3.1790 |
Wastewater Permits
| Permit Number |
Type |
Permitted Capacity
(MGD) |
Design Capacity
(MGD) |
Average Annual
Daily Discharge
(MGD) |
Maximum Day Discharge
(MGD) |
Receiving Stream |
Receiving Basin |
| NC0025011 |
|
4.5000 |
11.0000 |
2.7500 |
7.3900 |
Pasquotank River |
Albemarle Sound (12-1) |
| NC0036447 |
|
0.0000 |
0.0000 |
0.0570 |
0.0000 |
Knobbs Creek |
Albemarle Sound (12-1) |
WQ0002883 - Land applied 1389 dry tons 5. Planning
Projections
| |
2002 |
2010 |
2020 |
2030 |
| Year-Round Population |
15,700 |
16,700 |
17,800 |
18,900 |
| Seasonal Population |
0 |
0 |
0 |
0 |
| |
| Residential |
0.7370 |
0.7840 |
0.8340 |
0.8870 |
| Commercial |
0.3430 |
0.3640 |
0.3880 |
0.4120 |
| Industrial |
0.0390 |
0.0410 |
0.0440 |
0.0460 |
| Institutional |
0.3370 |
0.3580 |
0.3810 |
0.4050 |
| System Process |
0.1650 |
0.1750 |
0.1860 |
0.1980 |
| Unaccounted-for |
0.5350 |
0.2290 |
0.2430 |
0.2590 |
Increase of 6% per 10 years. Future Supply Sources
| Source Name |
PWSID |
Source Type |
Additional Supply |
Year Online |
Year Offline |
Type |
| Elizabeth City WTP 2010 Wells |
04-70-010 |
Ground |
0.2880 |
2010 |
|
Regular |
| Elizabeth City WTP 2020 Wells |
04-70-010 |
Ground |
0.2880 |
2020 |
|
Regular |
| Elizabeth City WTP 2030 Wells |
04-70-010 |
Ground |
0.2880 |
2030 |
|
Regular |
| Elizabeth City WTP 2040 Wells |
04-70-010 |
Ground |
0.2880 |
2040 |
|
Regular |
| Elizabeth City WTP 2050 Wells |
04-70-010 |
Ground |
0.2880 |
2050 |
|
Regular |
Plans to develop 2 wells every 10 years with anticipated yield of 200 gpm each. Sales Contracts have decreased significantly due to the fact that South Camden WSD has their own water supply and no longer purchases water from Elizabeth City. Demand projections still reflect potential sales to South Camden WSD. Discounting the average daily usage listed in South Camden WSD contract, Elizabeth City's well construction plan may maintain Demand as Percent of Supply at less than 80%. Demand v/s Percent of Supply
| |
2002 |
2010 |
2020 |
2030 |
| Surface Water Supply |
0.0000 |
0.0000 |
0.0000 |
0.0000 |
| Ground Water Supply |
1.9220 |
1.9220 |
1.9220 |
1.9220 |
| Purchases |
0.5000 |
0.5000 |
0.5000 |
0.5000 |
| Future Supplies |
0.2880 |
0.5760 |
0.8640 |
| Total Available Supply (MGD) |
2.4220 |
2.7100 |
2.9980 |
3.2860 |
| Service Area Demand |
2.1560 |
1.9510 |
2.0760 |
2.2070 |
| Sales |
0.2094 |
0.3030 |
0.3030 |
0.3030 |
| Future Sales |
0.0000 |
0.0000 |
0.0000 |
| Total Demand (MGD) |
2.3654 |
2.2540 |
2.3790 |
2.5100 |
| Demand as Percent of Supply |
98% |
83% |
79% |
76% |

The purpose of the above chart is to show a general indication of how the long-term per capita water demand changes over time. The per capita water demand may actually be different than indicated due to seasonal populations and the accuracy of data submitted. Water systems that have calculated long-term per capita water demand based on a methodology that produces different results may submit their information in the notes field.
Your long-term water demand is 47 gallons per capita per day. What demand management practices do you plan to implement to reduce the per capita water demand (i.e. conduct regular water audits, implement a plumbing retrofit program, employ practices such as rainwater harvesting or reclaimed water)? If these practices are covered elsewhere in your plan, indicate where the practices are discussed here.
Are there other demand management practices you will implement to reduce your future supply needs?
What supplies other than the ones listed in future supplies are being considered to meet your future supply needs?
How does the water system intend to implement the demand management and supply planning components above?
Sales Contracts have decreased significantly due to the fact that South Camden WSD has their own water supply and no longer purchases water from Elizabeth City. Demand projections still reflect potential sales to South Camden WSD. Discounting the average daily usage listed in South Camden WSD contract, Elizabeth City's well construction plan may maintain Demand as Percent of Supply at less than 80%. Additional Information
Has this system participated in regional water supply or water use planning? No
What major water supply reports or studies were used for planning?
Please describe any other needs or issues regarding your water supply sources, any water system deficiencies or needed improvements (storage, treatment, etc.) or your ability to meet present and future water needs. Include both quantity and quality considerations, as well as financial, technical, managerial, permitting, and compliance issues: Unaccounted for water usage is one issue that should be addressed. We are in need of metering equipment at each well and upgraded metering equipment and the treatment facility. Also a more comprehensive leak detection program is in need of development. In order to protect the integrity of current raw water suppply, the city will begin developing a Wellhead Protection Program. Also, in order to meet future demand, a redundant raw water supply line from the wellfield to the treatment facility will need to be laid. This will serve a two-fold purpose, one being the age of the exisiting transmission line, the facility would be able to continue receiving the raw supply if it were to fail, and two being the increased future demand will necessitate the need for an additional line to insure an adequate amount of water delivery to the treatment facility. The city has explored the possiblility of developing a deep well system with 2 MGD supply and reverse osmosis treatment. Pilot testing has been completed; however, due to the financial considerations and issues with permitting and discharge location of brine disposal the city has opted to expand the existing shallow wellfield with the addition of approximately 10 additional wells with a projected combined yield of 2 MGD.
The Division of Water Resources (DWR) provides the data contained within this
Local Water Supply Plan (LWSP) as a courtesy and service to our customers.
DWR staff does not field verify data. Neither DWR, nor any other party
involved in the preparation of this LWSP attests that the data is completely
free of errors and omissions. Furthermore, data users are cautioned that
LWSPs labeled PROVISIONAL have yet to be reviewed by DWR staff. Subsequent
review may result in significant revision. Questions regarding the accuracy
or limitations of usage of this data should be directed to the water system
and/or DWR.
|