|
The Division of Water Resources (DWR) provides the data contained within this
Local Water Supply Plan (LWSP) as a courtesy and service to our customers.
DWR staff does not field verify data. Neither DWR, nor any other party
involved in the preparation of this LWSP attests that the data is completely
free of errors and omissions. Furthermore, data users are cautioned that
LWSPs labeled PROVISIONAL have yet to be reviewed by DWR staff. Subsequent
review may result in significant revision. Questions regarding the accuracy
or limitations of usage of this data should be directed to the water system
and/or DWR.
1. System Information
Contact Information
Complete
| Water System Name: |
Elizabeth City |
|
PWSID: |
04-70-010 |
| Mailing Address: | PO Box 347
Elizabeth City, NC 27909 | Ownership: | Municipality |
| |
| Contact Person: | Gregory Colvin | Title: | Water Treatment Plant Supt. |
| Phone: | 252-337-6647 | Cell/Mobile: | 252-333-2540 |
| |
| Secondary Contact: | Dwan Bell | | Phone: | 252-337-6628 |
| Mailing Address: | PO Box 347
Elizabeth City, NC 27907-0347 | Cell/Mobile: | 252-333-2540 |
Distribution System
| Line Type |
Size Range (Inches) |
Estimated % of lines |
| Asbestos Cement |
6-8 |
1.40 % |
| Cast Iron |
4,-12 |
20.00 % |
| Ductile Iron |
4-20 |
3.47 % |
| Galvanized Iron |
2 |
0.13 % |
| Polyvinyl Chloride |
2-20 |
75.00 % |
Programs
Water Conservation
2. Water Use Information
Service Area
| Sub-Basin(s) | % of Service Population |
|---|
| Albemarle Sound (12-1) | 100 % |
|
| County(s) | % of Service Population |
|---|
| Pasquotank | 100 % |
|
Water Use by Type
| Type of Use |
Metered
Connections |
Metered
Average Use (MGD) |
Non-Metered
Connections |
Non-Metered
Estimated Use (MGD) |
| Residential |
7,277 |
0.7901 |
0 |
0.0000 |
| Commercial |
1,144 |
0.6797 |
0 |
0.0000 |
| Industrial |
14 |
0.0083 |
0 |
0.0000 |
| Institutional |
90 |
0.0534 |
0 |
0.0000 |
How much water was used for system processes (backwash, line cleaning, flushing, etc.)? 0.5850 MGD
Water Sales
| Purchaser |
PWSID |
Average
Daily Sold
(MGD) |
Days
Used |
Contract |
Required to
comply with water
use restrictions? |
Pipe Size(s)
(Inches) |
Use
Type |
| MGD |
Expiration |
Recurring |
| Pasquotank County R.O |
60-70-000 |
0.0015 |
365 |
|
|
No |
Yes |
24 |
Regular |
| Pasquotank County Water |
04-70-015 |
0.0000 |
365 |
|
|
No |
Yes |
8 |
Emergency |
| South Camden W & S District |
04-15-015 |
0.0000 |
0 |
|
|
No |
Yes |
6 |
Emergency |
3. Water Supply Sources
Monthly Withdrawals & Purchases
|
Average Daily
Use (MGD) |
Max Day
Use (MGD) |
|
Average Daily
Use (MGD) |
Max Day
Use (MGD) |
|
Average Daily
Use (MGD) |
Max Day
Use (MGD) |
| Jan |
2.1020 |
|
May |
2.1520 |
|
Sep |
2.6470 |
|
| Feb |
2.1020 |
|
Jun |
2.1810 |
|
Oct |
3.4090 |
|
| Mar |
2.0980 |
|
Jul |
2.2320 |
|
Nov |
2.5200 |
|
| Apr |
2.5660 |
|
Aug |
2.7610 |
|
Dec |
2.3800 |
|

Ground Water Sources
| Name or Number |
Average Daily Withdrawal (MGD) |
Max Day Withdrawal (MGD) |
12-Hour Supply
(MGD) |
CUA Reduction |
Year Offline |
Use Type |
| MGD |
Days Used |
| 01 |
0.1836 |
365 |
|
0.2160 |
|
|
Regular |
| 02 |
0.1680 |
365 |
|
0.1440 |
|
|
Regular |
| 03 |
0.1767 |
365 |
|
0.2880 |
|
|
Regular |
| 04 |
0.1996 |
365 |
|
0.2398 |
|
|
Regular |
| 05 |
0.1932 |
365 |
|
0.0360 |
|
|
Regular |
| 07 |
0.1754 |
365 |
|
0.0720 |
|
|
Regular |
| 08 |
0.1807 |
365 |
|
0.2880 |
|
|
Regular |
| 09 |
0.1826 |
365 |
|
0.2880 |
|
|
Regular |
| 10 |
0.1588 |
365 |
|
0.2700 |
|
|
Regular |
| 11 |
0.0706 |
365 |
|
0.0900 |
|
|
Regular |
| 13 |
0.1426 |
365 |
|
0.1080 |
|
|
Regular |
| 14 |
0.1772 |
365 |
|
0.2988 |
|
|
Regular |
| 15 |
0.1467 |
365 |
|
0.1476 |
|
|
Regular |
| 16 |
0.1013 |
365 |
|
0.1786 |
|
|
Regular |
| 6 |
0.0000 |
0 |
|
0.0000 |
|
2018 |
Regular |
Ground Water Sources (continued)
| Name or Number |
Well Depth (Feet) |
Casing Depth
(Feet) |
Screen Depth (Feet) |
Well Diameter (Inches) |
Pump Intake Depth (Feet) |
Metered? |
| Top |
Bottom |
| 01 |
117 |
60 |
98 |
101 |
6 |
65 |
Yes |
| 02 |
113 |
65 |
57 |
87 |
8 |
65 |
Yes |
| 03 |
125 |
60 |
94 |
120 |
10 |
93 |
Yes |
| 04 |
140 |
80 |
94 |
119 |
10 |
95 |
Yes |
| 05 |
103 |
103 |
78 |
98 |
8 |
56 |
No |
| 07 |
94 |
28 |
56 |
66 |
6 |
56 |
Yes |
| 08 |
126 |
115 |
90 |
110 |
8 |
80 |
Yes |
| 09 |
117 |
112 |
97 |
107 |
8 |
47 |
Yes |
| 10 |
130 |
115 |
85 |
110 |
8 |
58 |
Yes |
| 11 |
126 |
111 |
50 |
65 |
8 |
63 |
Yes |
| 13 |
107 |
67 |
67 |
102 |
8 |
63 |
Yes |
| 14 |
121 |
96 |
96 |
116 |
8 |
92 |
Yes |
| 15 |
112 |
72 |
72 |
107 |
8 |
69 |
Yes |
| 16 |
115 |
70 |
70 |
110 |
8 |
67 |
Yes |
| 6 |
87 |
53 |
77 |
87 |
6 |
|
No |
Water Purchases From Other Systems
| Seller |
PWSID |
Average
Daily Purchased
(MGD) |
Days
Used |
Contract |
Required to
comply with water
use restrictions? |
Pipe Size(s)
(Inches) |
Use
Type |
| MGD |
Expiration |
Recurring |
| Pasquotank County |
04-70-015 |
0.0076 |
365 |
|
|
No |
Yes |
8 |
Regular |
| Pasquotank R.O. System |
60-70-000 |
0.1815 |
365 |
|
|
No |
Yes |
24 |
Regular |
| South Camden Water & Sewer Dist. |
04-15-015 |
0.0000 |
0 |
|
|
No |
Yes |
6 |
Emergency |
Values are based on detailed billing records. Water Treatment Plants
| Plant Name |
Permitted Capacity
(MGD) |
Is Raw Water Metered? |
Is Finished Water Ouput Metered? |
Source |
| Elizabeth City WTP |
5.0000 |
Yes |
Yes |
Groundwater |
4. Wastewater Information
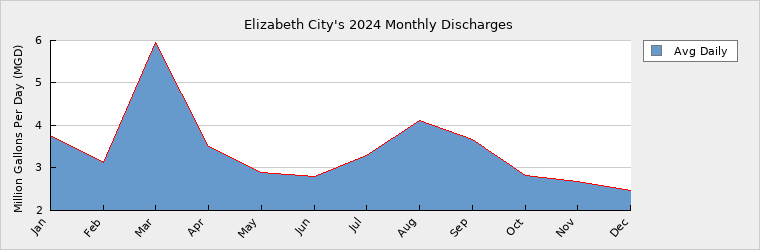
Monthly Discharges
|
Average Daily
Discharge (MGD) |
|
Average Daily
Discharge (MGD) |
|
Average Daily
Discharge (MGD) |
| Jan |
3.7600 |
May |
2.9000 |
Sep |
3.6800 |
| Feb |
3.1200 |
Jun |
2.8100 |
Oct |
2.8300 |
| Mar |
5.9500 |
Jul |
3.3000 |
Nov |
2.6900 |
| Apr |
3.5100 |
Aug |
4.1100 |
Dec |
2.4700 |
Wastewater Permits
| Permit Number |
Type |
Permitted Capacity
(MGD) |
Design Capacity
(MGD) |
Average Annual
Daily Discharge
(MGD) |
Maximum Day Discharge
(MGD) |
Receiving Stream |
Receiving Basin |
| NC0025011 |
WWTP |
4.5000 |
4.5000 |
3.4300 |
21.1600 |
Pasquotank River |
Albemarle Sound (12-1) |
| NC0036447 |
WWTP |
0.0000 |
0.0000 |
0.0000 |
0.0000 |
Knobbs Creek |
Albemarle Sound (12-1) |
5. Planning
Projections
| |
2024 |
2030 |
2040 |
2050 |
2060 |
2070 |
| Year-Round Population |
18,948 |
18,948 |
18,948 |
18,948 |
18,948 |
18,948 |
| Seasonal Population |
0 |
0 |
0 |
0 |
0 |
0 |
| |
| Residential |
0.7901 |
0.7916 |
0.7920 |
0.7920 |
0.7920 |
0.7920 |
| Commercial |
0.6797 |
0.4173 |
0.0417 |
0.4173 |
0.4173 |
0.4173 |
| Industrial |
0.0083 |
0.0063 |
0.0063 |
0.0063 |
0.0063 |
0.0063 |
| Institutional |
0.0534 |
0.3021 |
0.3021 |
0.3021 |
0.3021 |
0.3021 |
| System Process |
0.5850 |
0.2800 |
0.2800 |
0.2800 |
0.2800 |
0.2800 |
| Unaccounted-for |
0.3214 |
0.2729 |
0.2160 |
0.2730 |
0.2730 |
0.2730 |
Future Supply Sources
| Source Name |
PWSID |
Source Type |
Additional Supply |
Year Online |
Year Offline |
Type |
| Ground source |
04-70-010 |
Ground |
0.7800 |
2026 |
|
Regular |
| Ground source |
04-70-010 |
Ground |
0.7800 |
2026 |
|
Regular |
The city plans to drill up to 4 new wells and is working with geologists, to assess current well capacities, and possible site locations for new wells.
Demand v/s Percent of Supply
| |
2024 |
2030 |
2040 |
2050 |
2060 |
2070 |
| Surface Water Supply |
0.0000 |
0.0000 |
0.0000 |
0.0000 |
0.0000 |
0.0000 |
| Ground Water Supply |
2.6648 |
2.6648 |
2.6648 |
2.6648 |
2.6648 |
2.6648 |
| Purchases |
0.1891 |
0.1891 |
0.1891 |
0.1891 |
0.1891 |
0.1891 |
| Future Supplies |
1.5600 |
1.5600 |
1.5600 |
1.5600 |
1.5600 |
| Total Available Supply (MGD) |
2.8539 |
4.4139 |
4.4139 |
4.4139 |
4.4139 |
4.4139 |
| Service Area Demand |
2.4379 |
2.0702 |
1.6381 |
2.0707 |
2.0707 |
2.0707 |
| Sales |
0.0015 |
0.0015 |
0.0015 |
0.0015 |
0.0015 |
0.0015 |
| Future Sales |
0.0000 |
0.0000 |
0.0000 |
0.0000 |
0.0000 |
| Total Demand (MGD) |
2.4394 |
2.0717 |
1.6396 |
2.0722 |
2.0722 |
2.0722 |
| Demand as Percent of Supply |
85% |
47% |
37% |
47% |
47% |
47% |

The purpose of the above chart is to show a general indication of how the long-term per capita water demand changes over time. The per capita water demand may actually be different than indicated due to seasonal populations and the accuracy of data submitted. Water systems that have calculated long-term per capita water demand based on a methodology that produces different results may submit their information in the notes field.
Your long-term water demand is 42 gallons per capita per day. What demand management practices do you plan to implement to reduce the per capita water demand (i.e. conduct regular water audits, implement a plumbing retrofit program, employ practices such as rainwater harvesting or reclaimed water)? If these practices are covered elsewhere in your plan, indicate where the practices are discussed here.
Increase personnel, to allow a dedicated leak detection team. Drill 1 additional well per year for the next four years or longer if necessary to meet consumer demands.
Are there other demand management practices you will implement to reduce your future supply needs? Slow development, and place a moratorium on new construction. Until infrastructure catches up with the demand.
What supplies other than the ones listed in future supplies are being considered to meet your future supply needs? Continue to purchase water from Pasquotank county's interconnection.
How does the water system intend to implement the demand management and supply planning components above? Hire engineering firm to assist, technical, aspects. Funding will have to come out of our enterprise fund. Work with DEQ/ PWWS to discuss permitting requirements as necessary.
Additional Information
Has this system participated in regional water supply or water use planning? No
What major water supply reports or studies were used for planning?
Please describe any other needs or issues regarding your water supply sources, any water system deficiencies or needed improvements (storage, treatment, etc.) or your ability to meet present and future water needs. Include both quantity and quality considerations, as well as financial, technical, managerial, permitting, and compliance issues:
The Division of Water Resources (DWR) provides the data contained within this
Local Water Supply Plan (LWSP) as a courtesy and service to our customers.
DWR staff does not field verify data. Neither DWR, nor any other party
involved in the preparation of this LWSP attests that the data is completely
free of errors and omissions. Furthermore, data users are cautioned that
LWSPs labeled PROVISIONAL have yet to be reviewed by DWR staff. Subsequent
review may result in significant revision. Questions regarding the accuracy
or limitations of usage of this data should be directed to the water system
and/or DWR.
|