|
The Division of Water Resources (DWR) provides the data contained within this
Local Water Supply Plan (LWSP) as a courtesy and service to our customers.
DWR staff does not field verify data. Neither DWR, nor any other party
involved in the preparation of this LWSP attests that the data is completely
free of errors and omissions. Furthermore, data users are cautioned that
LWSPs labeled PROVISIONAL have yet to be reviewed by DWR staff. Subsequent
review may result in significant revision. Questions regarding the accuracy
or limitations of usage of this data should be directed to the water system
and/or DWR.
1. System Information
Contact Information
Complete
| Water System Name: |
Greenville Utilities Commission |
|
PWSID: |
04-74-010 |
| Mailing Address: | PO Box 1847
Greenville, NC 27835 | Ownership: | Municipality |
| |
| Contact Person: | Julius Patrick | Title: | Water Treatment Facilities Manager |
| Phone: | 252-551-1561 | Cell/Mobile: | -- |
| |
| Secondary Contact: | Anthony Whitehead | | Phone: | 252-329-2160 |
| Mailing Address: | PO Box 1847
Greenville, NC 27835 | Cell/Mobile: | -- |
Distribution System
| Line Type |
Size Range (Inches) |
Estimated % of lines |
| Asbestos Cement |
4-16 |
16.02 % |
| Cast Iron |
4-18 |
10.98 % |
| Ductile Iron |
4-36 |
5.58 % |
| Other |
4-24 |
1.75 % |
| Polyvinyl Chloride |
2-16 |
65.67 % |
Programs
Each hydrant is inspected/operated at least every 5 years.
Critical valves are exercised/inspected annually, other valves have a goal of every 5 years.
Leak detection is initiated whenever Greenville Utilities Commission (GUC) water system's annual average unaccounted-for losses exceed AWWA standards for comparable systems or whenever there is a known or suspected significant leak. The GUC water system is divided into 10 geographically defined zones and is systematically visually inspected. Priority crossings at waterways are also inspected. Leak detection equipment (FUJI DNR-18) is utilized by trained GUC personnel to pinpoint leaks not readily detectable by visual observation or where the location of the leak cannot otherwise be adequately determined. In addition, pressure points are monitored via SCADA and additional sensors were recently installed to collect, analyze and alert for abnormal transients in the system. Significant leaks are repaired immediately following detection and all minor leaks are repaired as soon as practical following their detection. Water Conservation
GUC does have several emergency interconnects with several neighboring systems (Bell Arthur, Eastern Pines, Farmville, and Winterville), that could supply a portion of our needs, but none are large enough to meet our total need for water. There are no other systems in close proximity with the size mains or pumping capacity. 2. Water Use Information
Service Area
| Sub-Basin(s) | % of Service Population |
|---|
| Tar River (15-1) | 73 % |
| Neuse River (10-1) | 27 % |
|
| County(s) | % of Service Population |
|---|
| Pitt | 100 % |
|
Water Use by Type
| Type of Use |
Metered
Connections |
Metered
Average Use (MGD) |
Non-Metered
Connections |
Non-Metered
Estimated Use (MGD) |
| Residential |
35,750 |
6.2500 |
0 |
0.0000 |
| Commercial |
3,717 |
2.8200 |
0 |
0.0000 |
| Industrial |
25 |
1.0800 |
0 |
0.0000 |
| Institutional |
0 |
0.0000 |
0 |
0.0000 |
How much water was used for system processes (backwash, line cleaning, flushing, etc.)? 2.4380 MGD
System processes=Average daily raw water - average daily total water use by type - average daily wholesale usage Water Sales
| Purchaser |
PWSID |
Average
Daily Sold
(MGD) |
Days
Used |
Contract |
Required to
comply with water
use restrictions? |
Pipe Size(s)
(Inches) |
Use
Type |
| MGD |
Expiration |
Recurring |
| Bell Arthur WC |
04-74-045 |
0.0000 |
0 |
0.0000 |
|
No |
No |
6 |
Emergency |
| Eastern Pines WC |
04-74-015 |
0.0000 |
0 |
0.0000 |
|
No |
No |
6 |
Emergency |
| Farmville |
04-74-020 |
0.8720 |
180 |
1.2000 |
2056 |
Yes |
Yes |
20 |
Regular |
| Greene County |
04-40-106 |
1.3500 |
176 |
2.1440 |
2056 |
Yes |
Yes |
24 |
Regular |
| Stokes Regional Water Corporation |
04-74-060 |
0.2350 |
366 |
0.5000 |
2048 |
Yes |
Yes |
8 |
Regular |
| Winterville |
04-74-040 |
0.4510 |
366 |
0.6000 |
2034 |
Yes |
Yes |
10 |
Regular |
3. Water Supply Sources
Monthly Withdrawals & Purchases
|
Average Daily
Use (MGD) |
Max Day
Use (MGD) |
|
Average Daily
Use (MGD) |
Max Day
Use (MGD) |
|
Average Daily
Use (MGD) |
Max Day
Use (MGD) |
| Jan |
16.1540 |
17.9960 |
May |
13.7420 |
17.1070 |
Sep |
15.4320 |
19.0030 |
| Feb |
15.6070 |
19.2590 |
Jun |
16.4090 |
20.1460 |
Oct |
17.4990 |
20.9330 |
| Mar |
14.8440 |
16.8300 |
Jul |
14.8590 |
18.9410 |
Nov |
16.7330 |
18.3710 |
| Apr |
13.8540 |
17.1750 |
Aug |
15.4060 |
17.8260 |
Dec |
15.4070 |
18.9490 |

Ground Water Sources
| Name or Number |
Average Daily Withdrawal (MGD) |
Max Day Withdrawal (MGD) |
12-Hour Supply
(MGD) |
CUA Reduction |
Year Offline |
Use Type |
| MGD |
Days Used |
| ASR |
0.0000 |
0 |
0.0000 |
0.3600 |
CUA25 |
|
Emergency |
| ASR-Inject |
0.0000 |
0 |
0.0000 |
0.3600 |
CUA0 |
|
Emergency |
| BWW |
0.0000 |
0 |
0.0000 |
0.2160 |
CUA25 |
|
Emergency |
| ESW |
0.0000 |
0 |
0.0000 |
0.2088 |
CUA25 |
|
Emergency |
| EW2 |
0.0000 |
0 |
0.00 |
0.1692 |
CUA25 |
|
Regular |
| EW4 |
0.0000 |
0 |
0.00 |
0.2592 |
CUA25 |
|
Regular |
| IBW |
0.0000 |
0 |
0.0000 |
0.2232 |
CUA25 |
|
Emergency |
| NGW |
0.0000 |
0 |
0.0000 |
0.1980 |
CUA25 |
|
Emergency |
| NSW |
0.0000 |
0 |
0.0000 |
0.1368 |
CUA25 |
|
Emergency |
| TW1 |
0.0000 |
0 |
0.0000 |
0.7200 |
CUA25 |
|
Emergency |
| WSW |
0.0000 |
0 |
0.00 |
0.1440 |
CUA25 |
|
Regular |
Ground Water Sources (continued)
| Name or Number |
Well Depth (Feet) |
Casing Depth
(Feet) |
Screen Depth (Feet) |
Well Diameter (Inches) |
Pump Intake Depth (Feet) |
Metered? |
| Top |
Bottom |
| ASR |
399 |
|
350 |
365 |
12 |
347 |
Yes |
| ASR-Inject |
399 |
|
350 |
365 |
12 |
347 |
Yes |
| BWW |
435 |
|
251 |
430 |
12 |
282 |
Yes |
| ESW |
487 |
|
210 |
484 |
6 |
192 |
Yes |
| EW2 |
452 |
|
210 |
452 |
12 |
201 |
Yes |
| EW4 |
458 |
|
192 |
458 |
14 |
246 |
Yes |
| IBW |
429 |
|
250 |
424 |
12 |
240 |
Yes |
| NGW |
489 |
|
260 |
404 |
6 |
210 |
Yes |
| NSW |
454 |
|
176 |
454 |
14 |
245 |
Yes |
| TW1 |
399 |
|
317 |
372 |
10 |
310 |
Yes |
| WSW |
417 |
|
166 |
417 |
6 |
189 |
Yes |
Surface Water Sources
| Stream |
Reservoir |
Average Daily Withdrawal |
Maximum Day
Withdrawal (MGD) |
Available Raw
Water Supply |
Usable On-Stream
Raw Water Supply
Storage (MG) |
| MGD |
Days Used |
MGD |
* Qualifier |
| Tar River |
|
15.4960 |
366 |
20.1460 |
32.0000 |
F |
32.0000 |
* Qualifier: C=Contract Amount, SY20=20-year Safe Yield, SY50=50-year Safe Yield, F=20% of 7Q10 or other instream flow requirement, CUA=Capacity Use Area Permit
Surface Water Sources (continued)
| Stream |
Reservoir |
Drainage Area
(sq mi) |
Metered? |
Sub-Basin |
County |
Year
Offline |
Use
Type |
| Tar River |
|
2,620 |
Yes |
Tar River (15-1) |
Pitt |
|
Regular |
Water Purchases From Other Systems
| Seller |
PWSID |
Average
Daily Purchased
(MGD) |
Days
Used |
Contract |
Required to
comply with water
use restrictions? |
Pipe Size(s)
(Inches) |
Use
Type |
| MGD |
Expiration |
Recurring |
| Bell Arthur WC |
04-74-045 |
0.0000 |
0 |
0.0000 |
|
No |
No |
6 |
Emergency |
| Eastern Pines WC |
04-74-015 |
0.0000 |
0 |
0.0000 |
|
No |
No |
6 |
Emergency |
| Town of Farmville |
04-74-020 |
0.0000 |
0 |
|
|
No |
No |
24 |
Emergency |
| Winterville |
04-74-040 |
0.0000 |
0 |
0.0000 |
|
No |
No |
10 |
Emergency |
Water Treatment Plants
| Plant Name |
Permitted Capacity
(MGD) |
Is Raw Water Metered? |
Is Finished Water Ouput Metered? |
Source |
| Greenville Utilities Commissio |
32.0000 |
Yes |
Yes |
Tar River |
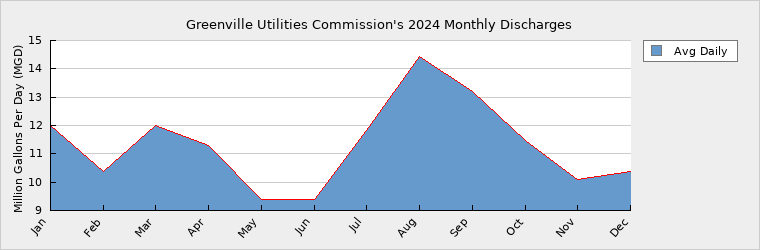
4. Wastewater Information
Monthly Discharges
|
Average Daily
Discharge (MGD) |
|
Average Daily
Discharge (MGD) |
|
Average Daily
Discharge (MGD) |
| Jan |
12.0170 |
May |
9.3810 |
Sep |
13.2090 |
| Feb |
10.3690 |
Jun |
9.3960 |
Oct |
11.4710 |
| Mar |
12.0010 |
Jul |
11.8230 |
Nov |
10.0990 |
| Apr |
11.3100 |
Aug |
14.4360 |
Dec |
10.3600 |
Yes – constructing two additional 125-ft. diameter clarifiers anticipated completion summer 2025. Not planning to increase permitted capacity at this time. Wastewater Permits
| Permit Number |
Type |
Permitted Capacity
(MGD) |
Design Capacity
(MGD) |
Average Annual
Daily Discharge
(MGD) |
Maximum Day Discharge
(MGD) |
Receiving Stream |
Receiving Basin |
| NC0023931 |
WWTP |
17.5000 |
17.5000 |
10.7400 |
|
Tar River |
Tar River (15-1) |
| NC0082139 |
WTP |
1.0000 |
0.5000 |
0.5840 |
|
Tar River |
Tar River (15-1) |
Wastewater Interconnections
| Water System |
PWSID |
Type |
Average Daily Amount |
Contract
Maximum (MGD) |
| MGD |
Days Used |
| Grimesland |
04-74-055 |
Receiving |
0.0310 |
366 |
0.0700 |
5. Planning
Projections
| |
2024 |
2030 |
2040 |
2050 |
2060 |
2070 |
| Year-Round Population |
121,500 |
162,072 |
215,273 |
285,938 |
356,603 |
389,000 |
| Seasonal Population |
0 |
0 |
0 |
0 |
0 |
0 |
| |
| Residential |
6.2500 |
8.2830 |
10.8130 |
14.3340 |
18.0050 |
20.3860 |
| Commercial |
2.8200 |
3.7410 |
4.8830 |
6.4700 |
8.1310 |
9.2060 |
| Industrial |
1.0800 |
1.4360 |
1.8750 |
2.4850 |
3.1220 |
3.5350 |
| Institutional |
0.0000 |
0.0000 |
0.0000 |
0.0000 |
0.0000 |
0.0000 |
| System Process |
2.4380 |
3.2400 |
4.2290 |
5.6070 |
7.0420 |
7.9730 |
| Unaccounted-for |
1.1440 |
1.5177 |
1.9812 |
2.6261 |
3.2990 |
3.7352 |
Population projection data was exported from the GUC 2018 Preliminary Engineering Report for the WTP Phase 1 Upgrade. Projections were developed using a statistical analysis of historical population. Best fit projection annual growth rate of 2.9% was used for this plan.
Demand projections are from the 2018 Preliminary Engineering Report for WTP Phase 1 Upgrade. The report provided low growth, best fit and high growth projections. The demand projections used for the LWSP were the best fit projections.
The water use projections were exported from the 2018 PER and excludes wholesale demand-2030-16.7 MGD; 2040-21.8 MGD; 2050-28.9 MGD; 2060-36.3MGD; 2070-41.1 MGD. The break down into user types was accomplished by using the average day water pumped for 2023, 15.496 MGD - 2.908 MGD wholesale usage (12.588 MGD) and dividing it by user type to determine the percentage of water for each and then applying those percentages to the projections numbers. For example, residential use for 2024 was 6.25 MGD divided by 12.588 MGD=.496 or 49.6%; The percentages used for projections by type are: Residential 49.6%, Commercial 22.4%, Industrial 8.6%, System Processes 19.4% Future Supply Sources
| Source Name |
PWSID |
Source Type |
Additional Supply |
Year Online |
Year Offline |
Type |
| Tar River |
04-74-010 |
Surface |
10.0000 |
2040 |
|
Regular |
| Tar River |
04-74-010 |
Surface |
10.0000 |
2050 |
|
Regular |
| Tar River |
04-74-010 |
Surface |
10.0000 |
2070 |
|
Regular |
Future water plant expansions and timeframes are referenced in the 2018 Greenville Utilities Preliminary Engineering Report.
Demand v/s Percent of Supply
| |
2024 |
2030 |
2040 |
2050 |
2060 |
2070 |
| Surface Water Supply |
32.0000 |
32.0000 |
32.0000 |
32.0000 |
32.0000 |
32.0000 |
| Ground Water Supply |
0.3011 |
0.3011 |
0.3011 |
0.3011 |
0.3011 |
0.3011 |
| Purchases |
0.0000 |
0.0000 |
0.0000 |
0.0000 |
0.0000 |
0.0000 |
| Future Supplies |
0.0000 |
10.0000 |
20.0000 |
20.0000 |
30.0000 |
| Total Available Supply (MGD) |
32.3011 |
32.3011 |
42.3011 |
52.3011 |
52.3011 |
62.3011 |
| Service Area Demand |
13.7320 |
18.2177 |
23.7812 |
31.5221 |
39.5990 |
44.8352 |
| Sales |
1.7640 |
4.4440 |
4.4440 |
4.4440 |
4.4440 |
4.4440 |
| Future Sales |
0.0000 |
0.0000 |
0.0000 |
0.0000 |
0.0000 |
| Total Demand (MGD) |
15.4960 |
22.6617 |
28.2252 |
35.9661 |
44.0430 |
49.2792 |
| Demand as Percent of Supply |
48% |
70% |
67% |
69% |
84% |
79% |

The purpose of the above chart is to show a general indication of how the long-term per capita water demand changes over time. The per capita water demand may actually be different than indicated due to seasonal populations and the accuracy of data submitted. Water systems that have calculated long-term per capita water demand based on a methodology that produces different results may submit their information in the notes field.
Your long-term water demand is 51 gallons per capita per day. What demand management practices do you plan to implement to reduce the per capita water demand (i.e. conduct regular water audits, implement a plumbing retrofit program, employ practices such as rainwater harvesting or reclaimed water)? If these practices are covered elsewhere in your plan, indicate where the practices are discussed here.
Are there other demand management practices you will implement to reduce your future supply needs?
What supplies other than the ones listed in future supplies are being considered to meet your future supply needs?
How does the water system intend to implement the demand management and supply planning components above?
Additional Information
Has this system participated in regional water supply or water use planning? Yes, Regional water supply planning with adjacent systems have come about due to the CCPCUA and the necessity for these systems to find alternate water sources. Greenville Utilities Commission (GUC) has become a regional water supplier for these systems as a result of this planning. GUC acquired Bethel system in 2021. Bethel was previously a wholesale customer.
In addition, 2011 GUC and the Neuse Regional Water & Sewer Authority completed a feasibility study that examined the potential for an interconnect between the two systems.
What major water supply reports or studies were used for planning? 2013 Tar River Flow Study
2014 WTP Master Plan
2018 Phase I Preliminary Engineering Report
Please describe any other needs or issues regarding your water supply sources, any water system deficiencies or needed improvements (storage, treatment, etc.) or your ability to meet present and future water needs. Include both quantity and quality considerations, as well as financial, technical, managerial, permitting, and compliance issues:
The Division of Water Resources (DWR) provides the data contained within this
Local Water Supply Plan (LWSP) as a courtesy and service to our customers.
DWR staff does not field verify data. Neither DWR, nor any other party
involved in the preparation of this LWSP attests that the data is completely
free of errors and omissions. Furthermore, data users are cautioned that
LWSPs labeled PROVISIONAL have yet to be reviewed by DWR staff. Subsequent
review may result in significant revision. Questions regarding the accuracy
or limitations of usage of this data should be directed to the water system
and/or DWR.
|