|
The Division of Water Resources (DWR) provides the data contained within this
Local Water Supply Plan (LWSP) as a courtesy and service to our customers.
DWR staff does not field verify data. Neither DWR, nor any other party
involved in the preparation of this LWSP attests that the data is completely
free of errors and omissions. Furthermore, data users are cautioned that
LWSPs labeled PROVISIONAL have yet to be reviewed by DWR staff. Subsequent
review may result in significant revision. Questions regarding the accuracy
or limitations of usage of this data should be directed to the water system
and/or DWR.
1. System Information
Contact Information
Complete
| Water System Name: |
Winterville, Town of |
|
PWSID: |
04-74-040 |
| Mailing Address: | PO Box 1459
Winterville, NC 28590 | Ownership: | Municipality |
| |
| Contact Person: | Cliff McGuffin | Title: | Public Works Director |
| Phone: | 252-215-2428 | Cell/Mobile: | 252-414-8793 |
| |
| Secondary Contact: | Mike Houston | | Phone: | 919-812-6088 |
| Mailing Address: |
, NC 28525 | Cell/Mobile: | 252-414-8793 |
Distribution System
| Line Type |
Size Range (Inches) |
Estimated % of lines |
| Asbestos Cement |
6-12 |
8.00 % |
| Cast Iron |
1-10 |
1.00 % |
| Ductile Iron |
6-12 |
0.50 % |
| Galvanized Iron |
1-2 |
0.50 % |
| Polyvinyl Chloride |
2-12 |
90.00 % |
Programs
Employees look for leaks while in the field and utilize NCRWA on an as needed basis. Water Conservation
2. Water Use Information
Service Area
| Sub-Basin(s) | % of Service Population |
|---|
| Neuse River (10-1) | 100 % |
|
| County(s) | % of Service Population |
|---|
| Pitt | 100 % |
|
Water Use by Type
| Type of Use |
Metered
Connections |
Metered
Average Use (MGD) |
Non-Metered
Connections |
Non-Metered
Estimated Use (MGD) |
| Residential |
4,278 |
0.5366 |
0 |
0.0000 |
| Commercial |
285 |
0.0831 |
0 |
0.0000 |
| Industrial |
0 |
0.0000 |
0 |
0.0000 |
| Institutional |
0 |
0.0000 |
0 |
0.0000 |
How much water was used for system processes (backwash, line cleaning, flushing, etc.)? 0.0200 MGD
Water Sales
| Purchaser |
PWSID |
Average
Daily Sold
(MGD) |
Days
Used |
Contract |
Required to
comply with water
use restrictions? |
Pipe Size(s)
(Inches) |
Use
Type |
| MGD |
Expiration |
Recurring |
| Bell Arthur Water |
04-74-045 |
0.0000 |
0 |
0.0000 |
9999 |
No |
No |
10 |
Emergency |
| Greenville Utilities |
04-74-010 |
0.0000 |
0 |
0.0000 |
2034 |
Yes |
Yes |
12 |
Emergency |
3. Water Supply Sources
Monthly Withdrawals & Purchases
|
Average Daily
Use (MGD) |
Max Day
Use (MGD) |
|
Average Daily
Use (MGD) |
Max Day
Use (MGD) |
|
Average Daily
Use (MGD) |
Max Day
Use (MGD) |
| Jan |
0.6077 |
|
May |
0.7194 |
|
Sep |
0.6269 |
|
| Feb |
0.6087 |
|
Jun |
0.8624 |
|
Oct |
0.6480 |
|
| Mar |
0.6184 |
|
Jul |
0.7220 |
|
Nov |
0.6408 |
|
| Apr |
0.6366 |
|
Aug |
0.6673 |
|
Dec |
0.6194 |
|

Ground Water Sources
| Name or Number |
Average Daily Withdrawal (MGD) |
Max Day Withdrawal (MGD) |
12-Hour Supply
(MGD) |
CUA Reduction |
Year Offline |
Use Type |
| MGD |
Days Used |
| 2 |
0.0800 |
312 |
0.2510 |
0.1656 |
CUA25 |
|
Regular |
| 3 |
0.0000 |
0 |
0.0000 |
0.1080 |
CUA25 |
2010 |
Emergency |
| 4 |
0.1670 |
312 |
0.5210 |
0.4320 |
CUA25 |
|
Regular |
Ground Water Sources (continued)
| Name or Number |
Well Depth (Feet) |
Casing Depth
(Feet) |
Screen Depth (Feet) |
Well Diameter (Inches) |
Pump Intake Depth (Feet) |
Metered? |
| Top |
Bottom |
| 2 |
436 |
|
340 |
432 |
10 |
215 |
Yes |
| 3 |
377 |
|
240 |
372 |
10 |
205 |
Yes |
| 4 |
432 |
|
326 |
427 |
12 |
190 |
Yes |
Water Purchases From Other Systems
| Seller |
PWSID |
Average
Daily Purchased
(MGD) |
Days
Used |
Contract |
Required to
comply with water
use restrictions? |
Pipe Size(s)
(Inches) |
Use
Type |
| MGD |
Expiration |
Recurring |
| Bell Arthur Water |
04-74-045 |
0.0000 |
0 |
0.0000 |
9999 |
No |
No |
10 |
Emergency |
| Greenville Utilities Commission |
04-74-010 |
0.4510 |
366 |
0.6000 |
2034 |
Yes |
Yes |
12 |
Regular |
4. Wastewater Information
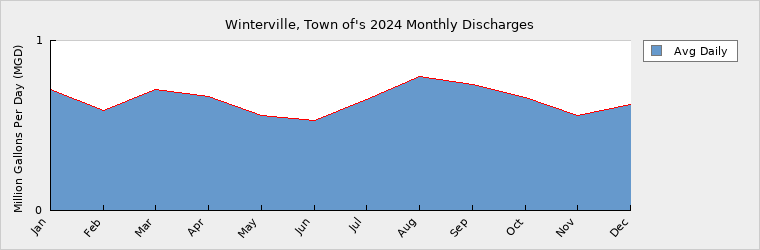
Monthly Discharges
|
Average Daily
Discharge (MGD) |
|
Average Daily
Discharge (MGD) |
|
Average Daily
Discharge (MGD) |
| Jan |
0.7099 |
May |
0.5569 |
Sep |
0.7397 |
| Feb |
0.5868 |
Jun |
0.5267 |
Oct |
0.6642 |
| Mar |
0.7104 |
Jul |
0.6532 |
Nov |
0.5604 |
| Apr |
0.6714 |
Aug |
0.7873 |
Dec |
0.6225 |
Wastewater Permits
| Permit Number |
Type |
Permitted Capacity
(MGD) |
Design Capacity
(MGD) |
Average Annual
Daily Discharge
(MGD) |
Maximum Day Discharge
(MGD) |
Receiving Stream |
Receiving Basin |
| NC0032077 |
WWTP |
3.5000 |
4.0000 |
0.6497 |
|
Contentnea Creek / Neuse River |
Neuse River (10-1) |
5. Planning
Projections
| |
2024 |
2030 |
2040 |
2050 |
2060 |
2070 |
| Year-Round Population |
10,792 |
10,812 |
11,422 |
12,000 |
12,607 |
13,245 |
| Seasonal Population |
0 |
0 |
0 |
0 |
0 |
0 |
| |
| Residential |
0.5366 |
0.5298 |
0.5597 |
0.5880 |
0.6177 |
0.6490 |
| Commercial |
0.0831 |
0.0859 |
0.0907 |
0.0953 |
0.1007 |
0.1052 |
| Industrial |
0.0000 |
0.0000 |
0.0000 |
0.0000 |
0.0000 |
0.0000 |
| Institutional |
0.0000 |
0.0000 |
0.0000 |
0.0000 |
0.0000 |
0.0000 |
| System Process |
0.0200 |
0.0206 |
0.0217 |
0.0227 |
0.0238 |
0.0250 |
| Unaccounted-for |
0.0219 |
0.0226 |
0.0239 |
0.0251 |
0.0264 |
0.0277 |
We got confirmation last year that GUC would agree to an increase from 0.600 MGD to 0.750 MGD should the need arise in the future. Accordingly, the additional 0.150 MGD is shown here as a Future Supply.
Future Supply Sources
| Source Name |
PWSID |
Source Type |
Additional Supply |
Year Online |
Year Offline |
Type |
| Greenville Utilities Commission |
04-74-010 |
Purchase |
0.1500 |
2026 |
|
Regular |
We got confirmation last year that GUC would agree to an increase from 0.600 MGD to 0.750 MGD should the need arise in the future. Accordingly, the additional 0.150 MGD is shown here as a Future Supply. Demand v/s Percent of Supply
| |
2024 |
2030 |
2040 |
2050 |
2060 |
2070 |
| Surface Water Supply |
0.0000 |
0.0000 |
0.0000 |
0.0000 |
0.0000 |
0.0000 |
| Ground Water Supply |
0.2475 |
0.2475 |
0.2475 |
0.2475 |
0.2475 |
0.2475 |
| Purchases |
0.6000 |
0.6000 |
0.6000 |
0.6000 |
0.6000 |
0.6000 |
| Future Supplies |
0.1500 |
0.1500 |
0.1500 |
0.1500 |
0.1500 |
| Total Available Supply (MGD) |
0.8475 |
0.9975 |
0.9975 |
0.9975 |
0.9975 |
0.9975 |
| Service Area Demand |
0.6616 |
0.6589 |
0.6960 |
0.7311 |
0.7686 |
0.8069 |
| Sales |
0.0000 |
0.0000 |
0.0000 |
0.0000 |
0.0000 |
0.0000 |
| Future Sales |
0.0000 |
0.0000 |
0.0000 |
0.0000 |
0.0000 |
| Total Demand (MGD) |
0.6616 |
0.6589 |
0.6960 |
0.7311 |
0.7686 |
0.8069 |
| Demand as Percent of Supply |
78% |
66% |
70% |
73% |
77% |
81% |

The purpose of the above chart is to show a general indication of how the long-term per capita water demand changes over time. The per capita water demand may actually be different than indicated due to seasonal populations and the accuracy of data submitted. Water systems that have calculated long-term per capita water demand based on a methodology that produces different results may submit their information in the notes field.
Your long-term water demand is 50 gallons per capita per day. What demand management practices do you plan to implement to reduce the per capita water demand (i.e. conduct regular water audits, implement a plumbing retrofit program, employ practices such as rainwater harvesting or reclaimed water)? If these practices are covered elsewhere in your plan, indicate where the practices are discussed here.
Work with surface water supplier to increase purchased water contract amount. Maximize well usage based off permitted amounts.
Are there other demand management practices you will implement to reduce your future supply needs? Public education about water conservation and more efficient fixtures and programs to help educate the consumers.
What supplies other than the ones listed in future supplies are being considered to meet your future supply needs? As for the future water capacity for the Town we have been working with the Wooten Company Engineering firm to come up with a plan to better provide water for the Town. We are looking into an additional elevated tank and bigger distribution lines as the town is growing rapidly. We are also looking at our purchase agreement with Greenville Utilities Commission to purchase more water in the future as demand increases. Wooten has all the numbers, and we meet regularly to look at the hydraulics and plan accordingly so to stay ahead of the increase in growth.
How does the water system intend to implement the demand management and supply planning components above? N/A
Additional Information
Has this system participated in regional water supply or water use planning? Yes, CCPCUA
What major water supply reports or studies were used for planning? CCPCUA
Please describe any other needs or issues regarding your water supply sources, any water system deficiencies or needed improvements (storage, treatment, etc.) or your ability to meet present and future water needs. Include both quantity and quality considerations, as well as financial, technical, managerial, permitting, and compliance issues: More staffing is needed to ensure proper flushing of the system and to keep up the demand of work orders for our growing system and aging infrastructure.
The Division of Water Resources (DWR) provides the data contained within this
Local Water Supply Plan (LWSP) as a courtesy and service to our customers.
DWR staff does not field verify data. Neither DWR, nor any other party
involved in the preparation of this LWSP attests that the data is completely
free of errors and omissions. Furthermore, data users are cautioned that
LWSPs labeled PROVISIONAL have yet to be reviewed by DWR staff. Subsequent
review may result in significant revision. Questions regarding the accuracy
or limitations of usage of this data should be directed to the water system
and/or DWR.
|