|
The Division of Water Resources (DWR) provides the data contained within this
Local Water Supply Plan (LWSP) as a courtesy and service to our customers.
DWR staff does not field verify data. Neither DWR, nor any other party
involved in the preparation of this LWSP attests that the data is completely
free of errors and omissions. Furthermore, data users are cautioned that
LWSPs labeled PROVISIONAL have yet to be reviewed by DWR staff. Subsequent
review may result in significant revision. Questions regarding the accuracy
or limitations of usage of this data should be directed to the water system
and/or DWR.
1. System Information
Contact Information
Complete
| Water System Name: |
Goldsboro |
|
PWSID: |
04-96-010 |
| Mailing Address: | P.O. Drawer A
Goldsboro, NC 27533-9701 | Ownership: | Municipality |
| |
| Contact Person: | Robert Sherman | Title: | Public Utilities Director |
| Phone: | 919-735-3329 | Cell/Mobile: | 919-750-1210 |
Distribution System
| Line Type |
Size Range (Inches) |
Estimated % of lines |
| Asbestos Cement |
8-10 |
5.20 % |
| Ductile Iron |
4-16 |
87.20 % |
| Galvanized Iron |
2-10 |
2.20 % |
| Polyvinyl Chloride |
4-20 |
5.40 % |
A boring contractor working for Lumos bored through an 8" water line at 1818 S. Slocumb Street causing several apartment complexes to lose water pressure for around 8 hours. We contacted Clif Whitfield with NCDWR to make him aware of the situation and also issued boil water notices. Programs
The AMI system has the ability to detect leaks beyond the meters. The SCADA system at the Water Treatment Plant will alert operators is the elevated tank levels drop more than 5% in an hour. Water Conservation
Reclaimed water is used at the city's municipal golf course, a 144 acre farm land, and for bulk reuse water. 2. Water Use Information
Service Area
| Sub-Basin(s) | % of Service Population |
|---|
| Neuse River (10-1) | 100 % |
|
| County(s) | % of Service Population |
|---|
| Wayne | 100 % |
|
Water Use by Type
| Type of Use |
Metered
Connections |
Metered
Average Use (MGD) |
Non-Metered
Connections |
Non-Metered
Estimated Use (MGD) |
| Residential |
11,401 |
1.4370 |
0 |
0.0000 |
| Commercial |
2,299 |
1.2760 |
0 |
0.0000 |
| Industrial |
2 |
0.7740 |
0 |
0.0000 |
| Institutional |
0 |
0.0000 |
0 |
0.0000 |
How much water was used for system processes (backwash, line cleaning, flushing, etc.)? 0.1660 MGD
Water Sales
| Purchaser |
PWSID |
Average
Daily Sold
(MGD) |
Days
Used |
Contract |
Required to
comply with water
use restrictions? |
Pipe Size(s)
(Inches) |
Use
Type |
| MGD |
Expiration |
Recurring |
| Fork Township SD Purchase system |
60-96-002 |
0.1753 |
366 |
0.5000 |
2037 |
Yes |
Yes |
12 |
Regular |
| Seymour Johnson Air Force Base |
04-96-055 |
0.3896 |
366 |
|
|
Yes |
Yes |
|
Regular |
| Wayne Water Districts Purchase |
60-96-001 |
0.3741 |
366 |
3.2000 |
2034 |
Yes |
Yes |
12,16 |
Regular |
3. Water Supply Sources
Monthly Withdrawals & Purchases
|
Average Daily
Use (MGD) |
Max Day
Use (MGD) |
|
Average Daily
Use (MGD) |
Max Day
Use (MGD) |
|
Average Daily
Use (MGD) |
Max Day
Use (MGD) |
| Jan |
5.9280 |
6.8200 |
May |
6.2200 |
7.4600 |
Sep |
6.2940 |
7.8600 |
| Feb |
5.6460 |
6.1600 |
Jun |
6.6270 |
7.6400 |
Oct |
6.0440 |
6.7400 |
| Mar |
5.5060 |
6.7000 |
Jul |
6.6840 |
7.9800 |
Nov |
5.7940 |
6.9600 |
| Apr |
5.6890 |
6.5300 |
Aug |
6.7170 |
7.8600 |
Dec |
5.9370 |
7.0200 |

Surface Water Sources
| Stream |
Reservoir |
Average Daily Withdrawal |
Maximum Day
Withdrawal (MGD) |
Available Raw
Water Supply |
Usable On-Stream
Raw Water Supply
Storage (MG) |
| MGD |
Days Used |
MGD |
* Qualifier |
| Little River |
|
0.0000 |
0 |
0.0000 |
0.6460 |
F |
0.0000 |
| Neuse River |
|
6.0900 |
366 |
7.9800 |
25.8530 |
F |
35.0000 |
* Qualifier: C=Contract Amount, SY20=20-year Safe Yield, SY50=50-year Safe Yield, F=20% of 7Q10 or other instream flow requirement, CUA=Capacity Use Area Permit
Surface Water Sources (continued)
| Stream |
Reservoir |
Drainage Area
(sq mi) |
Metered? |
Sub-Basin |
County |
Year
Offline |
Use
Type |
| Little River |
|
310 |
Yes |
Neuse River (10-1) |
Wayne |
|
Emergency |
| Neuse River |
|
2,050 |
Yes |
Neuse River (10-1) |
Wayne |
|
Regular |
Water Purchases From Other Systems
| Seller |
PWSID |
Average
Daily Purchased
(MGD) |
Days
Used |
Contract |
Required to
comply with water
use restrictions? |
Pipe Size(s)
(Inches) |
Use
Type |
| MGD |
Expiration |
Recurring |
| Fork Township Sanitary District |
04-96-060 |
0.0000 |
0 |
1.0220 |
2037 |
Yes |
Yes |
12, 6 |
Emergency |
| Wayne Water Districts Purchase |
60-96-001 |
0.0000 |
0 |
3.1775 |
2034 |
Yes |
Yes |
6,12 |
Emergency |
Water Treatment Plants
| Plant Name |
Permitted Capacity
(MGD) |
Is Raw Water Metered? |
Is Finished Water Ouput Metered? |
Source |
| City of Goldsboro Water Plant |
14.0000 |
Yes |
Yes |
Neuse River |
4. Wastewater Information
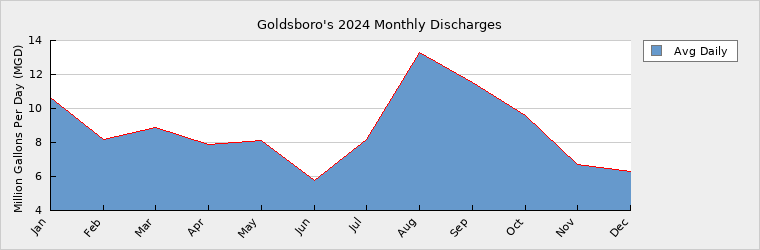
Monthly Discharges
|
Average Daily
Discharge (MGD) |
|
Average Daily
Discharge (MGD) |
|
Average Daily
Discharge (MGD) |
| Jan |
10.6300 |
May |
8.1100 |
Sep |
11.5200 |
| Feb |
8.1700 |
Jun |
5.7400 |
Oct |
9.6000 |
| Mar |
8.9100 |
Jul |
8.1500 |
Nov |
6.6900 |
| Apr |
7.9100 |
Aug |
13.3100 |
Dec |
6.3000 |
The City of Goldsboro has hired the engineering firm of Hazen & Sawyer and the construction firm from Crowder Construction to begin planning our wastewater expansion project. Wastewater Permits
| Permit Number |
Type |
Permitted Capacity
(MGD) |
Design Capacity
(MGD) |
Average Annual
Daily Discharge
(MGD) |
Maximum Day Discharge
(MGD) |
Receiving Stream |
Receiving Basin |
| NC0023949 |
WWTP |
14.2000 |
14.2000 |
8.7600 |
23.5800 |
Neuse River |
Neuse River (10-1) |
| WQ0017791 |
WWTP |
0.9450 |
0.9450 |
0.0500 |
6.3400 |
Reclaimed Water for irrigation |
Neuse River (10-1) |
The Flows for the year from reuse water (Permit # WQ00177791) are not included with the the discharge permit for the Water Reclamation Facility and Wetlands. It is indicated on this form as 0.0000 MGD flow from the permit, when in actuality 0.0500 MGD was used in irrigations for the year 2024. Wastewater Interconnections
| Water System |
PWSID |
Type |
Average Daily Amount |
Contract
Maximum (MGD) |
| MGD |
Days Used |
| County of Wayne |
00-00-000 |
Receiving |
0.1361 |
366 |
0.2500 |
| Fork Township Sanitary District |
04-96-060 |
Receiving |
0.0000 |
366 |
0.1250 |
| Town of Fremont |
04-96-025 |
Receiving |
0.2546 |
366 |
0.3000 |
| Village of Walnut Creek |
04-96-155 |
Receiving |
0.0371 |
366 |
0.1000 |
5. Planning
Projections
| |
2024 |
2030 |
2040 |
2050 |
2060 |
2070 |
| Year-Round Population |
33,443 |
33,237 |
32,087 |
30,977 |
29,906 |
28,872 |
| Seasonal Population |
0 |
0 |
0 |
0 |
0 |
0 |
| |
| Residential |
1.4370 |
1.3272 |
1.2813 |
1.2370 |
1.1942 |
1.1529 |
| Commercial |
1.2760 |
1.4049 |
1.4184 |
1.4325 |
1.4469 |
1.4614 |
| Industrial |
0.7740 |
1.1407 |
1.1407 |
1.1407 |
1.1407 |
1.1407 |
| Institutional |
0.0000 |
0.0000 |
0.0000 |
0.0000 |
0.0000 |
0.0000 |
| System Process |
0.1660 |
0.1900 |
0.1919 |
0.1938 |
0.1958 |
0.1977 |
| Unaccounted-for |
1.4980 |
1.6505 |
1.6381 |
1.6266 |
1.6159 |
1.6058 |
This information was obtained through the use of the the LWSP Projection Evaluation Tool. Demand v/s Percent of Supply
| |
2024 |
2030 |
2040 |
2050 |
2060 |
2070 |
| Surface Water Supply |
25.8530 |
25.8530 |
25.8530 |
25.8530 |
25.8530 |
25.8530 |
| Ground Water Supply |
0.0000 |
0.0000 |
0.0000 |
0.0000 |
0.0000 |
0.0000 |
| Purchases |
0.0000 |
0.0000 |
0.0000 |
0.0000 |
0.0000 |
0.0000 |
| Future Supplies |
0.0000 |
0.0000 |
0.0000 |
0.0000 |
0.0000 |
| Total Available Supply (MGD) |
25.8530 |
25.8530 |
25.8530 |
25.8530 |
25.8530 |
25.8530 |
| Service Area Demand |
5.1510 |
5.7133 |
5.6704 |
5.6306 |
5.5935 |
5.5585 |
| Sales |
0.9390 |
4.0896 |
4.0896 |
4.0896 |
4.0896 |
4.0896 |
| Future Sales |
0.0000 |
0.0000 |
0.0000 |
0.0000 |
0.0000 |
| Total Demand (MGD) |
6.0900 |
9.8029 |
9.7600 |
9.7202 |
9.6831 |
9.6481 |
| Demand as Percent of Supply |
24% |
38% |
38% |
38% |
37% |
37% |

The purpose of the above chart is to show a general indication of how the long-term per capita water demand changes over time. The per capita water demand may actually be different than indicated due to seasonal populations and the accuracy of data submitted. Water systems that have calculated long-term per capita water demand based on a methodology that produces different results may submit their information in the notes field.
Your long-term water demand is 43 gallons per capita per day. What demand management practices do you plan to implement to reduce the per capita water demand (i.e. conduct regular water audits, implement a plumbing retrofit program, employ practices such as rainwater harvesting or reclaimed water)? If these practices are covered elsewhere in your plan, indicate where the practices are discussed here.
No changes
Are there other demand management practices you will implement to reduce your future supply needs? No changes
What supplies other than the ones listed in future supplies are being considered to meet your future supply needs? No changes
How does the water system intend to implement the demand management and supply planning components above? No changes
Additional Information
Has this system participated in regional water supply or water use planning? Yes, The City of Goldsboro actively participates in The Wayne County Utilities Committee meetings to discuss current and future water and wastewater projects and to prepare in advance for any major projects that may be on the horizon. The city also works with surrounding communities on future projects which may include building a new water treatment plant.
What major water supply reports or studies were used for planning? The city completed a Water Asset Management Plan in Sept. 2022
Please describe any other needs or issues regarding your water supply sources, any water system deficiencies or needed improvements (storage, treatment, etc.) or your ability to meet present and future water needs. Include both quantity and quality considerations, as well as financial, technical, managerial, permitting, and compliance issues: Our unaccounted for water is once again around 24%. We found out that a fire line around our detention center had a water leak but that there was no meter attached, we are now in the process of attaching a meter to that line. We also want to ensure that all future fire lines are required to have a meter attached to them. We are also in the process of going out for bid to have mag-meters that have been pruchased to be installed at the water treatment plant and expect to begin this project at some point this year.
The Division of Water Resources (DWR) provides the data contained within this
Local Water Supply Plan (LWSP) as a courtesy and service to our customers.
DWR staff does not field verify data. Neither DWR, nor any other party
involved in the preparation of this LWSP attests that the data is completely
free of errors and omissions. Furthermore, data users are cautioned that
LWSPs labeled PROVISIONAL have yet to be reviewed by DWR staff. Subsequent
review may result in significant revision. Questions regarding the accuracy
or limitations of usage of this data should be directed to the water system
and/or DWR.
|