|
The Division of Water Resources (DWR) provides the data contained within this
Local Water Supply Plan (LWSP) as a courtesy and service to our customers.
DWR staff does not field verify data. Neither DWR, nor any other party
involved in the preparation of this LWSP attests that the data is completely
free of errors and omissions. Furthermore, data users are cautioned that
LWSPs labeled PROVISIONAL have yet to be reviewed by DWR staff. Subsequent
review may result in significant revision. Questions regarding the accuracy
or limitations of usage of this data should be directed to the water system
and/or DWR.
1. System Information
Contact Information
Complete
| Water System Name: |
Wilson |
|
PWSID: |
04-98-010 |
| Mailing Address: | P.O. Box 10
Wilson, NC 27894 | Ownership: | Municipality |
| |
| Contact Person: | Kyle Manning | Title: | Interim Director of Water Resources |
| Phone: | 252-296-3416 | Cell/Mobile: | 252-373-6556 |
| |
| Secondary Contact: | David Staab | | Phone: | 252-399-2376 |
| Mailing Address: | P.O. Box 10
Wilson, NC 27894 | Cell/Mobile: | 252-205-2518 |
Distribution System
| Line Type |
Size Range (Inches) |
Estimated % of lines |
| Asbestos Cement |
4-12 |
28.00 % |
| Cast Iron |
2-24 |
14.00 % |
| Ductile Iron |
2-30 |
15.00 % |
| Galvanized Iron |
2-6 |
0.30 % |
| Other |
2-24 |
0.70 % |
| Polyvinyl Chloride |
2-12 |
42.00 % |
Programs
Water Conservation
Wilson has two water treatment facilities and two water sources which provide redundancy. However, a simple explanation or "no" checked box does not explain our system adequately. None of our neighbors are large enough to supply all our total needs for water, but we do have several interconnections where we can feed our neighbors which are numbered for clarification. None are large enough, but all could be reversed to supply some water to our system in an emergency.
1) US 301 North Upchurch Road PS 12 inch line to (Wilson County SE District to US 301 other side 6 inch). This could also feed Rocky Mount thru Sharpsburg with a booster PS for emergencies. (this was installed in previous drought in 2008) and could be reversed as this area is at the same elevation as Wilson.
2) We are connected to the Town of Elm City thru the same 12 inch line and PS. This could be reversed as they are at a higher elevation if backflow by-passed.
3) We are interconnected to the Nash County system along NC 58 North at the Wilson / Nash County line. (valve currently closed) This would require a booster station which was installed during previous drought to feed Nash County and Rocky Mount. Again, this could be reversed as Nash County is at a higher elevation.
4) We have two interconnection with the SW District of Wilson County, one along Wiggins Mill Road near Springfield Middle School which feeds their Willing Worker Road PS and a 12 inch along NC 42 West at I95. Both can and do also supply the Northeast District of Johnston County with their PS at the Wilson / Johnston County line. This line could also be reversed as they are at a higher elevation as well. There are currently no agreements with any of our neighbors to reverse flow, only to supply them on a regular basis, or in an emergency, or as agreed upon by MOA. 2. Water Use Information
Service Area
| Sub-Basin(s) | % of Service Population |
|---|
| Contentnea Creek (10-2) | 99 % |
| Tar River (15-1) | 1 % |
|
| County(s) | % of Service Population |
|---|
| Wilson | 100 % |
|
Water Use by Type
| Type of Use |
Metered
Connections |
Metered
Average Use (MGD) |
Non-Metered
Connections |
Non-Metered
Estimated Use (MGD) |
| Residential |
21,385 |
2.7210 |
0 |
0.0000 |
| Commercial |
2,105 |
1.1630 |
0 |
0.0000 |
| Industrial |
49 |
1.0080 |
2 |
0.4000 |
| Institutional |
128 |
0.1740 |
0 |
0.0000 |
How much water was used for system processes (backwash, line cleaning, flushing, etc.)? 1.7450 MGD
Sold 0.764 MGD to bulk users. The two non-metered connections are the two water treatment plants. Water Sales
| Purchaser |
PWSID |
Average
Daily Sold
(MGD) |
Days
Used |
Contract |
Required to
comply with water
use restrictions? |
Pipe Size(s)
(Inches) |
Use
Type |
| MGD |
Expiration |
Recurring |
| Elm City |
04-98-020 |
0.1290 |
366 |
0.1000 |
2051 |
No |
Yes |
12 |
Regular |
| Johnston County |
03-51-070 |
0.6310 |
366 |
1.5000 |
2033 |
No |
Yes |
12 |
Regular |
| Wilson County SE WD |
40-98-014 |
0.1880 |
8 |
0.0790 |
2045 |
No |
Yes |
6 |
Regular |
| Wilson County SW WD |
40-98-012 |
0.0000 |
0 |
0.1710 |
2045 |
No |
Yes |
12 |
Regular |
We have a water contract for sales to Wilson County SE and SW Districts. Technically we are a regular supplier of water based on our contract, but because we almost never sale any water except in an extreme emergency or during a large main break we almost consider it an emergency. The use is indicated as Regular to match Wilson County since we have the capability and the contractual obligation to sale when demanded.
Wilson confirms the present sales contract with Elm City has a sales limit of 0.1000 MGD that expires in 2051. 3. Water Supply Sources
Monthly Withdrawals & Purchases
|
Average Daily
Use (MGD) |
Max Day
Use (MGD) |
|
Average Daily
Use (MGD) |
Max Day
Use (MGD) |
|
Average Daily
Use (MGD) |
Max Day
Use (MGD) |
| Jan |
7.9590 |
9.3600 |
May |
8.5580 |
10.7780 |
Sep |
8.5730 |
10.1090 |
| Feb |
7.8040 |
8.5820 |
Jun |
9.5870 |
11.6470 |
Oct |
8.2560 |
8.8890 |
| Mar |
7.5890 |
8.6170 |
Jul |
9.2850 |
10.8140 |
Nov |
7.9830 |
9.2130 |
| Apr |
7.9990 |
9.1140 |
Aug |
8.9510 |
10.2750 |
Dec |
7.7400 |
8.9400 |
Annual average was 8.357 MGD 
Surface Water Sources
| Stream |
Reservoir |
Average Daily Withdrawal |
Maximum Day
Withdrawal (MGD) |
Available Raw
Water Supply |
Usable On-Stream
Raw Water Supply
Storage (MG) |
| MGD |
Days Used |
MGD |
* Qualifier |
| Contentnea Creek |
Wiggins Mill Reservoir |
8.3570 |
366 |
11.6470 |
1.0000 |
SY50 |
240.0000 |
| Contentnea Creek |
Buckhorn Lake |
0.0000 |
0 |
0.0000 |
26.7000 |
SY50 |
6,726.0000 |
| Tar River |
Tar River Reservoir |
0.0000 |
0 |
0.0000 |
3.0000 |
SY50 |
3,500.0000 |
| Toisnot Swamp |
Toisnot Reservoir |
0.0000 |
0 |
0.0000 |
0.2000 |
SY50 |
20.0000 |
| Toisnot Swamp |
Lake Wilson |
0.0000 |
0 |
0.0000 |
1.0000 |
SY50 |
150.0000 |
* Qualifier: C=Contract Amount, SY20=20-year Safe Yield, SY50=50-year Safe Yield, F=20% of 7Q10 or other instream flow requirement, CUA=Capacity Use Area Permit
Surface Water Sources (continued)
| Stream |
Reservoir |
Drainage Area
(sq mi) |
Metered? |
Sub-Basin |
County |
Year
Offline |
Use
Type |
| Contentnea Creek |
Wiggins Mill Reservoir |
236 |
Yes |
Contentnea Creek (10-2) |
Wilson |
|
Regular |
| Contentnea Creek |
Buckhorn Lake |
160 |
No |
Contentnea Creek (10-2) |
Wilson |
|
Regular |
| Tar River |
Tar River Reservoir |
775 |
No |
Tar River (15-1) |
Nash |
|
Emergency |
| Toisnot Swamp |
Toisnot Reservoir |
60 |
Yes |
Contentnea Creek (10-2) |
Wilson |
|
Regular |
| Toisnot Swamp |
Lake Wilson |
40 |
No |
Contentnea Creek (10-2) |
Wilson |
|
Regular |
Transfers 1) Potable water to Johnston County North District. Contentnea Creek 10-2 in Neuse Basin to Little River in Neuse Basin 10-1 ). A portion of the district is within the Contentnea watershed and is not transferred.
2) Potable water to the Town of Elm City is a transfer from Contentnea Creek in Neuse Basin 10-2 to Town Creek in Tar Basin 15-1). Elm City land applies their wastewater.
3) A small portion of Wilson County SE district lies within Town Creek in the Tar River Basin 15-1 transferred from 10-2 Contentnea Creek
Releases: Agreement with ACE in Buckhorn Dam Permit to release 7.6,5.3, or 1.4 CFS into Contentnea Creek based on the Buckhorn Lake level. Buckhorn releases water downstream to Wiggins Mill Reservoir. Lake Wilson releases downstream to Toisnot Reservoir on the other side of town. The safe yield for Buckhorn is adjusted for evaporation, 50 year sedimentation (beginning in 1999), for required releases downstream, and for 10% active storage remaining. Otherwise the safe yield is 31.6 MGD Water Treatment Plants
| Plant Name |
Permitted Capacity
(MGD) |
Is Raw Water Metered? |
Is Finished Water Ouput Metered? |
Source |
| Toisnot WTP |
10.0000 |
Yes |
Yes |
Toisnot Reservoir or Wiggins Mill Reservoir |
| Wiggins Mill WTP |
12.0000 |
Yes |
Yes |
Wiggins Mill Reservoir (downstream of Buckhorn) |
Engineering plans 100% complete to expand Wiggins Mill from 12 to 16 MGD. Due to budgetary constraints, plans are being revised to only upgrade electrical components at this time and not increase capacity. 4. Wastewater Information
Monthly Discharges
|
Average Daily
Discharge (MGD) |
|
Average Daily
Discharge (MGD) |
|
Average Daily
Discharge (MGD) |
| Jan |
9.8100 |
May |
7.2800 |
Sep |
11.5200 |
| Feb |
7.3200 |
Jun |
6.0500 |
Oct |
9.0600 |
| Mar |
10.5600 |
Jul |
8.3600 |
Nov |
6.6300 |
| Apr |
7.8500 |
Aug |
10.9800 |
Dec |
6.7500 |
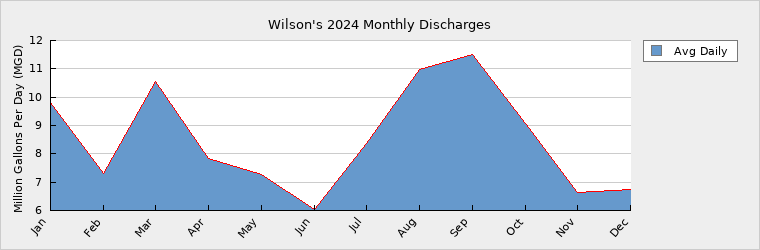
Average of 8.53 MGD for 2024. PER currently being performed by Hazen and Sawyer to expand the Hominy Creek WRF from 14 MGD to 17.3 or 20.7 MGD. Modeling Study to be performed with design 2024-2026 and construction date has not been decided. Estimated number of septic system connections by subtracting the difference between total residential water meters and total residential sewer customers. Wastewater Permits
| Permit Number |
Type |
Permitted Capacity
(MGD) |
Design Capacity
(MGD) |
Average Annual
Daily Discharge
(MGD) |
Maximum Day Discharge
(MGD) |
Receiving Stream |
Receiving Basin |
| NC0023906 |
WWTP |
14.0000 |
14.0000 |
8.5300 |
25.5400 |
Contentnea Creek |
Contentnea Creek (10-2) |
Wastewater Interconnections
| Water System |
PWSID |
Type |
Average Daily Amount |
Contract
Maximum (MGD) |
| MGD |
Days Used |
| Black Creek |
04-98-035 |
Receiving |
0.2632 |
366 |
0.5350 |
| Lucama |
04-98-030 |
Receiving |
0.0000 |
366 |
|
| Sims |
04-98-045 |
Receiving |
0.0310 |
366 |
0.0750 |
| Town of Saratoga |
04-98-040 |
Receiving |
0.0420 |
366 |
0.1000 |
We do not have a direct connection with Lucama. They discharge to Black Creek who discharges to the City. Accordingly, the sum of the Lucama and Black Creek discharges is equal to what we report receiving from Black Creek.
5. Planning
Projections
| |
2024 |
2030 |
2040 |
2050 |
2060 |
2070 |
| Year-Round Population |
49,827 |
55,000 |
69,000 |
83,000 |
97,000 |
112,000 |
| Seasonal Population |
0 |
0 |
0 |
0 |
0 |
0 |
| |
| Residential |
2.7210 |
3.0000 |
3.7800 |
4.5500 |
5.3200 |
6.0900 |
| Commercial |
1.1630 |
1.3900 |
1.9000 |
2.4700 |
3.0400 |
3.6100 |
| Industrial |
1.4080 |
1.8100 |
2.4700 |
3.2100 |
3.9500 |
4.6900 |
| Institutional |
0.1740 |
0.2100 |
0.2800 |
0.3700 |
0.4600 |
0.5400 |
| System Process |
1.7450 |
1.2450 |
1.2450 |
1.2450 |
1.2450 |
1.2450 |
| Unaccounted-for |
0.3819 |
0.4860 |
0.5920 |
0.6850 |
0.7422 |
0.8566 |
Projections extrapolated from the 2024 Water Master Plan developed by Freese and Nichols. Future Water Sales
| Purchaser |
PWSID |
Contract |
Pipe Size(s) (Inches) |
Use Type |
| MGD |
Year Begin |
Year End |
| Johnston County |
03-51-070 |
0.4900 |
2026 |
2051 |
12 |
Regular |
| Johnston County |
03-51-070 |
1.5000 |
2034 |
2051 |
12 |
Regular |
In negotiation with Johnston County to increase supply to 1.99 MGD in 2026. Demand v/s Percent of Supply
| |
2024 |
2030 |
2040 |
2050 |
2060 |
2070 |
| Surface Water Supply |
28.9000 |
28.9000 |
28.9000 |
28.9000 |
28.9000 |
28.9000 |
| Ground Water Supply |
0.0000 |
0.0000 |
0.0000 |
0.0000 |
0.0000 |
0.0000 |
| Purchases |
0.0000 |
0.0000 |
0.0000 |
0.0000 |
0.0000 |
0.0000 |
| Future Supplies |
0.0000 |
0.0000 |
0.0000 |
0.0000 |
0.0000 |
| Total Available Supply (MGD) |
28.9000 |
28.9000 |
28.9000 |
28.9000 |
28.9000 |
28.9000 |
| Service Area Demand |
7.5929 |
8.1410 |
10.2670 |
12.5300 |
14.7572 |
17.0316 |
| Sales |
0.7641 |
1.9880 |
0.4880 |
0.1290 |
0.0000 |
0.0000 |
| Future Sales |
0.4900 |
1.9900 |
1.9900 |
0.0000 |
0.0000 |
| Total Demand (MGD) |
8.3570 |
10.6190 |
12.7450 |
14.6490 |
14.7572 |
17.0316 |
| Demand as Percent of Supply |
29% |
37% |
44% |
51% |
51% |
59% |

The purpose of the above chart is to show a general indication of how the long-term per capita water demand changes over time. The per capita water demand may actually be different than indicated due to seasonal populations and the accuracy of data submitted. Water systems that have calculated long-term per capita water demand based on a methodology that produces different results may submit their information in the notes field.
Your long-term water demand is 55 gallons per capita per day. What demand management practices do you plan to implement to reduce the per capita water demand (i.e. conduct regular water audits, implement a plumbing retrofit program, employ practices such as rainwater harvesting or reclaimed water)? If these practices are covered elsewhere in your plan, indicate where the practices are discussed here.
No Changes
Are there other demand management practices you will implement to reduce your future supply needs?
What supplies other than the ones listed in future supplies are being considered to meet your future supply needs?
How does the water system intend to implement the demand management and supply planning components above?
Additional Information
Has this system participated in regional water supply or water use planning? No
What major water supply reports or studies were used for planning?
Please describe any other needs or issues regarding your water supply sources, any water system deficiencies or needed improvements (storage, treatment, etc.) or your ability to meet present and future water needs. Include both quantity and quality considerations, as well as financial, technical, managerial, permitting, and compliance issues:
The Division of Water Resources (DWR) provides the data contained within this
Local Water Supply Plan (LWSP) as a courtesy and service to our customers.
DWR staff does not field verify data. Neither DWR, nor any other party
involved in the preparation of this LWSP attests that the data is completely
free of errors and omissions. Furthermore, data users are cautioned that
LWSPs labeled PROVISIONAL have yet to be reviewed by DWR staff. Subsequent
review may result in significant revision. Questions regarding the accuracy
or limitations of usage of this data should be directed to the water system
and/or DWR.
|