|
The Division of Water Resources (DWR) provides the data contained within this
Local Water Supply Plan (LWSP) as a courtesy and service to our customers.
DWR staff does not field verify data. Neither DWR, nor any other party
involved in the preparation of this LWSP attests that the data is completely
free of errors and omissions. Furthermore, data users are cautioned that
LWSPs labeled PROVISIONAL have yet to be reviewed by DWR staff. Subsequent
review may result in significant revision. Questions regarding the accuracy
or limitations of usage of this data should be directed to the water system
and/or DWR.
1. System Information
Contact Information
Complete
| Water System Name: |
Stantonsburg |
|
PWSID: |
04-98-025 |
| Mailing Address: | P.O. Box 10
Stantonsburg, NC 27883 | Ownership: | Municipality |
| |
| Contact Person: | Roger Sullivan | Title: | Chief Utilities System Operator |
| Phone: | 252-238-3608 | Cell/Mobile: | 252-414-7800 |
| |
| Secondary Contact: | Brian Hawley | | Phone: | 252-238-3608 |
| Mailing Address: | PO Box 10
Stantonsburg, NC 27883 | Cell/Mobile: | -- |
Distribution System
| Line Type |
Size Range (Inches) |
Estimated % of lines |
| Asbestos Cement |
6 |
2.00 % |
| Cast Iron |
6-8 |
10.00 % |
| Ductile Iron |
6 |
5.00 % |
| Polyvinyl Chloride |
2-8 |
83.00 % |
Estimated miles of water lines have been updated to reflection GIS data on total length of lines. Programs
The Town closely monitors its monthly water sales/billing in comparison to water pumped for all wells. If a significant difference is found by administrative staff, the water department personnel are instructed to look for leaks, etc. In addition, daily wells readings are collected and compared to daily averages. If a significate difference is found, water department personnel are instructed to look for leaks, etc. also. Water Conservation
2. Water Use Information
Service Area
| Sub-Basin(s) | % of Service Population |
|---|
| Contentnea Creek (10-2) | 100 % |
|
| County(s) | % of Service Population |
|---|
| Wilson | 100 % |
|
Water Use by Type
| Type of Use |
Metered
Connections |
Metered
Average Use (MGD) |
Non-Metered
Connections |
Non-Metered
Estimated Use (MGD) |
| Residential |
564 |
0.0584 |
0 |
0.0000 |
| Commercial |
38 |
0.0112 |
0 |
0.0000 |
| Industrial |
1 |
0.0023 |
0 |
0.0000 |
| Institutional |
0 |
0.0000 |
0 |
0.0000 |
How much water was used for system processes (backwash, line cleaning, flushing, etc.)? 0.0040 MGD
Water Sales
| Purchaser |
PWSID |
Average
Daily Sold
(MGD) |
Days
Used |
Contract |
Required to
comply with water
use restrictions? |
Pipe Size(s)
(Inches) |
Use
Type |
| MGD |
Expiration |
Recurring |
| Wilson County SEWD |
40-98-014 |
0.2850 |
365 |
0.2500 |
2041 |
Yes |
Yes |
12 |
Regular |
3. Water Supply Sources
Monthly Withdrawals & Purchases
|
Average Daily
Use (MGD) |
Max Day
Use (MGD) |
|
Average Daily
Use (MGD) |
Max Day
Use (MGD) |
|
Average Daily
Use (MGD) |
Max Day
Use (MGD) |
| Jan |
0.3330 |
0.4430 |
May |
0.4400 |
0.5300 |
Sep |
0.3900 |
0.4480 |
| Feb |
0.3420 |
0.5010 |
Jun |
0.4010 |
0.5030 |
Oct |
0.3720 |
0.5010 |
| Mar |
0.3560 |
0.4440 |
Jul |
0.3840 |
0.5440 |
Nov |
0.3690 |
0.4640 |
| Apr |
0.3960 |
0.4730 |
Aug |
0.3900 |
0.4850 |
Dec |
0.3580 |
0.4590 |

Ground Water Sources
| Name or Number |
Average Daily Withdrawal (MGD) |
Max Day Withdrawal (MGD) |
12-Hour Supply
(MGD) |
CUA Reduction |
Year Offline |
Use Type |
| MGD |
Days Used |
| 1 |
0.1520 |
365 |
0.264 |
0.1584 |
CUA10 |
|
Regular |
| 2 |
0.0528 |
365 |
0.093 |
0.1368 |
CUA10 |
|
Regular |
| 3 |
0.0580 |
364 |
0.095 |
0.1296 |
CUA10 |
|
Regular |
| 4 |
0.0000 |
0 |
|
0.1440 |
CUA10 |
1975 |
Emergency |
| 4A |
0.0466 |
363 |
0.0912 |
0.0518 |
CUA10 |
|
Regular |
| 5 |
0.0707 |
362 |
0.127 |
0.1080 |
CUA10 |
|
Regular |
| 6 |
0.0000 |
0 |
|
0.2520 |
CUA0 |
|
Regular |
| Wilson |
0.0000 |
0 |
|
0.0000 |
CUA0 |
|
Emergency |
Ground Water Sources (continued)
| Name or Number |
Well Depth (Feet) |
Casing Depth
(Feet) |
Screen Depth (Feet) |
Well Diameter (Inches) |
Pump Intake Depth (Feet) |
Metered? |
| Top |
Bottom |
| 1 |
160 |
|
110 |
145 |
8 |
100 |
Yes |
| 2 |
160 |
|
120 |
150 |
8 |
117 |
Yes |
| 3 |
150 |
|
110 |
140 |
8 |
120 |
Yes |
| 4 |
140 |
|
107 |
0 |
8 |
0 |
No |
| 4A |
150 |
|
110 |
140 |
10 |
118 |
Yes |
| 5 |
180 |
|
130 |
170 |
10 |
120 |
Yes |
| 6 |
150 |
|
130 |
150 |
10 |
|
No |
| Wilson |
|
|
|
|
|
|
No |
Water Purchases From Other Systems
| Seller |
PWSID |
Average
Daily Purchased
(MGD) |
Days
Used |
Contract |
Required to
comply with water
use restrictions? |
Pipe Size(s)
(Inches) |
Use
Type |
| MGD |
Expiration |
Recurring |
| Wilson County SEWD |
40-98-014 |
0.1300 |
2 |
0.0000 |
2041 |
Yes |
Yes |
12 |
Emergency |
Due to a emergency water tower repair in June, the Town of Stantonsburg purchased water from Wilson County SEWD for 2 days. Water Treatment Plants
| Plant Name |
Permitted Capacity
(MGD) |
Is Raw Water Metered? |
Is Finished Water Ouput Metered? |
Source |
| Stantonsburg WTP |
0.5760 |
Yes |
Yes |
Groundwater |
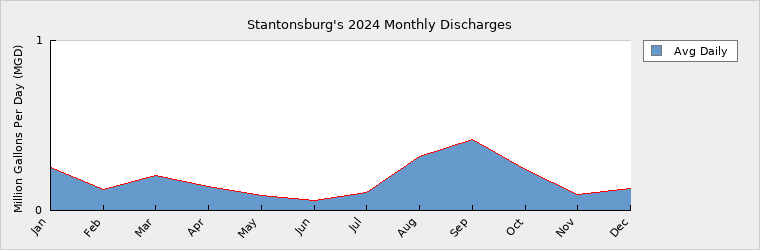
4. Wastewater Information
Monthly Discharges
|
Average Daily
Discharge (MGD) |
|
Average Daily
Discharge (MGD) |
|
Average Daily
Discharge (MGD) |
| Jan |
0.2500 |
May |
0.0890 |
Sep |
0.4190 |
| Feb |
0.1250 |
Jun |
0.0590 |
Oct |
0.2410 |
| Mar |
0.2060 |
Jul |
0.1050 |
Nov |
0.0920 |
| Apr |
0.1390 |
Aug |
0.3150 |
Dec |
0.1320 |
Wastewater Permits
| Permit Number |
Type |
Permitted Capacity
(MGD) |
Design Capacity
(MGD) |
Average Annual
Daily Discharge
(MGD) |
Maximum Day Discharge
(MGD) |
Receiving Stream |
Receiving Basin |
| NC0057606 |
WWTP |
0.3750 |
0.3750 |
0.1810 |
1.3970 |
Contentnea Creek |
Contentnea Creek (10-2) |
Wastewater Interconnections
| Water System |
PWSID |
Type |
Average Daily Amount |
Contract
Maximum (MGD) |
| MGD |
Days Used |
| Saratoga |
04-98-040 |
Receiving |
0.0000 |
0 |
0.0600 |
In July of 2021 the Town of Saratoga ceased sending waste water to the Stantonsburg WWTP and started sending wastewater the City of Wilson. The Town of Stantonsburg was placed on a Sewer Moratorium in the fall of 2021 due to being within 80% of daily average capacity in 2020. The Sewer Moratorium was lifted in late 2021 due to data showing the substantial decrease in flow after the Town of Saratoga stopped sending wastewater to Stantonsburg. 5. Planning
Projections
| |
2024 |
2030 |
2040 |
2050 |
2060 |
2070 |
| Year-Round Population |
1,275 |
1,350 |
1,435 |
1,525 |
1,625 |
1,730 |
| Seasonal Population |
0 |
0 |
0 |
0 |
0 |
0 |
| |
| Residential |
0.0584 |
0.0607 |
0.0646 |
0.0686 |
0.0731 |
0.0779 |
| Commercial |
0.0112 |
0.0068 |
0.0070 |
0.0071 |
0.0073 |
0.0075 |
| Industrial |
0.0023 |
0.0070 |
0.0070 |
0.0072 |
0.0073 |
0.0074 |
| Institutional |
0.0000 |
0.0000 |
0.0000 |
0.0000 |
0.0000 |
0.0000 |
| System Process |
0.0040 |
0.0040 |
0.0050 |
0.0055 |
0.0060 |
0.0065 |
| Unaccounted-for |
0.0187 |
0.0193 |
0.0206 |
0.0218 |
0.0231 |
0.0245 |
Demand v/s Percent of Supply
| |
2024 |
2030 |
2040 |
2050 |
2060 |
2070 |
| Surface Water Supply |
0.0000 |
0.0000 |
0.0000 |
0.0000 |
0.0000 |
0.0000 |
| Ground Water Supply |
0.6432 |
0.6432 |
0.6432 |
0.6432 |
0.6432 |
0.6432 |
| Purchases |
0.0000 |
0.0000 |
0.0000 |
0.0000 |
0.0000 |
0.0000 |
| Future Supplies |
0.0000 |
0.0000 |
0.0000 |
0.0000 |
0.0000 |
| Total Available Supply (MGD) |
0.6432 |
0.6432 |
0.6432 |
0.6432 |
0.6432 |
0.6432 |
| Service Area Demand |
0.0946 |
0.0978 |
0.1042 |
0.1102 |
0.1168 |
0.1238 |
| Sales |
0.2842 |
0.2850 |
0.2850 |
0.2850 |
0.2850 |
0.2850 |
| Future Sales |
0.0000 |
0.0000 |
0.0000 |
0.0000 |
0.0000 |
| Total Demand (MGD) |
0.3788 |
0.3828 |
0.3892 |
0.3952 |
0.4018 |
0.4088 |
| Demand as Percent of Supply |
59% |
60% |
61% |
61% |
62% |
64% |

The purpose of the above chart is to show a general indication of how the long-term per capita water demand changes over time. The per capita water demand may actually be different than indicated due to seasonal populations and the accuracy of data submitted. Water systems that have calculated long-term per capita water demand based on a methodology that produces different results may submit their information in the notes field.
Your long-term water demand is 46 gallons per capita per day. What demand management practices do you plan to implement to reduce the per capita water demand (i.e. conduct regular water audits, implement a plumbing retrofit program, employ practices such as rainwater harvesting or reclaimed water)? If these practices are covered elsewhere in your plan, indicate where the practices are discussed here.
No Changes
Are there other demand management practices you will implement to reduce your future supply needs? The water sales contract with Wilson County Southeastern Water District expires in 2041. The Town may seek to reduce the amount of water it sells or, at a minimum, maintain the current contracted amount in any future sales negotiations. In addition, the Town may seek a grant to conduct a water loss audit of its distribution system.
What supplies other than the ones listed in future supplies are being considered to meet your future supply needs? The Town of Stantonsburg has received a $310,000 grant and $310,000 zero percent interest loan from the Division of Water Infrastructure to drill a new well (with a minimum capacity of 0.080 MGD) outside of the reduction zone in the Central Coastal Plains Capacity Use Area. After delays in 2020, due to first test well falling below needed capacity, and then a second location fail to produce in 2021, the Town of Stantonsburg continues to search for a new well location. The Town may also seek to interconnect with neighboring water system(s) at some point in the future as an alternate source of water.
In 2023 Stantonsburg received additional funding to continues the search for a new ground water well.
How does the water system intend to implement the demand management and supply planning components above? The Town will seek any available grant funds and utilize its own operating revenues to finance these endeavors. The Town may also look to partner with the Southeastern Water District of Wilson County to assist in funding future projects.
Additional Information
Has this system participated in regional water supply or water use planning? No
What major water supply reports or studies were used for planning? The Town utilizes the Central Coastal Plains Capacity Use Area website and its own available water data for planning.
Please describe any other needs or issues regarding your water supply sources, any water system deficiencies or needed improvements (storage, treatment, etc.) or your ability to meet present and future water needs. Include both quantity and quality considerations, as well as financial, technical, managerial, permitting, and compliance issues: The Town would like to see grant funds and/or low interest loans made available so that is could drill additional wells outside the reduction zone of the Central Coastal Plains Capacity Use Area in order to meet future needs.
The Division of Water Resources (DWR) provides the data contained within this
Local Water Supply Plan (LWSP) as a courtesy and service to our customers.
DWR staff does not field verify data. Neither DWR, nor any other party
involved in the preparation of this LWSP attests that the data is completely
free of errors and omissions. Furthermore, data users are cautioned that
LWSPs labeled PROVISIONAL have yet to be reviewed by DWR staff. Subsequent
review may result in significant revision. Questions regarding the accuracy
or limitations of usage of this data should be directed to the water system
and/or DWR.
|