|
The Division of Water Resources (DWR) provides the data contained within this
Local Water Supply Plan (LWSP) as a courtesy and service to our customers.
DWR staff does not field verify data. Neither DWR, nor any other party
involved in the preparation of this LWSP attests that the data is completely
free of errors and omissions. Furthermore, data users are cautioned that
LWSPs labeled PROVISIONAL have yet to be reviewed by DWR staff. Subsequent
review may result in significant revision. Questions regarding the accuracy
or limitations of usage of this data should be directed to the water system
and/or DWR.
1. System Information
Contact Information
Complete
| Water System Name: |
Lucama |
|
PWSID: |
04-98-030 |
| Mailing Address: | PO Box 127
Lucama, NC 27851 | Ownership: | Municipality |
| |
| Contact Person: | Ashleigh Hooks | Title: | Utility Coordinator |
| Phone: | 252-239-0560 | Cell/Mobile: | - - |
| |
| Secondary Contact: | John Malone (NCRWA) | | Phone: | 336-780-0786 |
| Mailing Address: |
, | Cell/Mobile: | - - |
Distribution System
| Line Type |
Size Range (Inches) |
Estimated % of lines |
| Ductile Iron |
6 |
20.00 % |
| Polyvinyl Chloride |
6 |
80.00 % |
Programs
Water Conservation
There is an above ground (removable) emergency interconnection between hydrants that can be utilized in an emergency with Wilson County. A permanent connection is the goal for future, but not yet planned. 2. Water Use Information
Service Area
| Sub-Basin(s) | % of Service Population |
|---|
| Contentnea Creek (10-2) | 100 % |
|
| County(s) | % of Service Population |
|---|
| Wilson | 100 % |
|
Population / Connection Decrease from last year's reporting. PWS had a 1.85 person per household by NCDEQ Drinking water website. Calculated new population 466 connections x 1.85 per household = 862 Population. Water Use by Type
| Type of Use |
Metered
Connections |
Metered
Average Use (MGD) |
Non-Metered
Connections |
Non-Metered
Estimated Use (MGD) |
| Residential |
466 |
0.0444 |
0 |
0.0000 |
| Commercial |
0 |
0.0000 |
0 |
0.0000 |
| Industrial |
0 |
0.0000 |
0 |
0.0000 |
| Institutional |
0 |
0.0000 |
0 |
0.0000 |
How much water was used for system processes (backwash, line cleaning, flushing, etc.)? 0.0090 MGD
All connections are reported under Residential. System Process includes Filter Backwash & system maintenance flushing. 3. Water Supply Sources
Monthly Withdrawals & Purchases
|
Average Daily
Use (MGD) |
Max Day
Use (MGD) |
|
Average Daily
Use (MGD) |
Max Day
Use (MGD) |
|
Average Daily
Use (MGD) |
Max Day
Use (MGD) |
| Jan |
0.0732 |
|
May |
0.0702 |
|
Sep |
0.0774 |
|
| Feb |
0.0652 |
|
Jun |
0.0743 |
|
Oct |
0.0692 |
|
| Mar |
0.0639 |
|
Jul |
0.0727 |
|
Nov |
0.0766 |
|
| Apr |
0.0610 |
|
Aug |
0.0747 |
|
Dec |
0.0929 |
|
Water Purchased for 11 days in December 2024 from City of Wilson, included in December Average. 
Ground Water Sources
| Name or Number |
Average Daily Withdrawal (MGD) |
Max Day Withdrawal (MGD) |
12-Hour Supply
(MGD) |
CUA Reduction |
Year Offline |
Use Type |
| MGD |
Days Used |
| W03 |
0.0462 |
179 |
0.1647 |
0.1080 |
CUA0 |
|
Regular |
| W04 |
0.0420 |
188 |
0.1679 |
0.0936 |
CUA0 |
|
Regular |
| W05 |
0.0473 |
206 |
0.0987 |
0.0720 |
CUA0 |
|
Regular |
Ground Water Sources (continued)
| Name or Number |
Well Depth (Feet) |
Casing Depth
(Feet) |
Screen Depth (Feet) |
Well Diameter (Inches) |
Pump Intake Depth (Feet) |
Metered? |
| Top |
Bottom |
| W03 |
600 |
|
0 |
600 |
8 |
273 |
Yes |
| W04 |
400 |
|
0 |
400 |
8 |
201 |
Yes |
| W05 |
500 |
|
0 |
500 |
8 |
150 |
Yes |
The Town of Lucama has a current approved well head protection plan. (#146.1 - 04/23/2021)
The Well Sources all pump to the Lucama Filter Plant prior to distribution. Water Purchases From Other Systems
| Seller |
PWSID |
Average
Daily Purchased
(MGD) |
Days
Used |
Contract |
Required to
comply with water
use restrictions? |
Pipe Size(s)
(Inches) |
Use
Type |
| MGD |
Expiration |
Recurring |
| Wilson County SW |
04-12-012 |
0.0612 |
11 |
0.0000 |
|
No |
No |
2 |
Emergency |
Water purchased for 11 days through a temporary connection between hydrants when elevated tank was out of service for rehab. Water Treatment Plants
| Plant Name |
Permitted Capacity
(MGD) |
Is Raw Water Metered? |
Is Finished Water Ouput Metered? |
Source |
| Lucama Filter Plant |
0.5760 |
Yes |
No |
Wells - W03, W04, W05 |
4. Wastewater Information
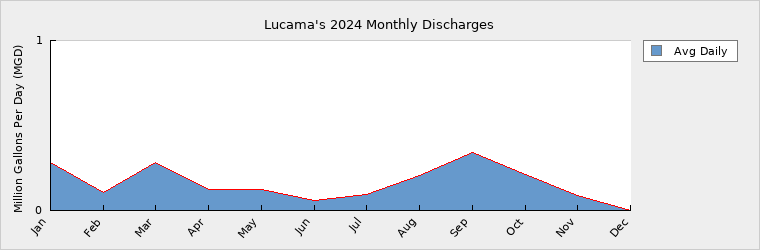
Monthly Discharges
|
Average Daily
Discharge (MGD) |
|
Average Daily
Discharge (MGD) |
|
Average Daily
Discharge (MGD) |
| Jan |
0.2824 |
May |
0.1231 |
Sep |
0.3440 |
| Feb |
0.1087 |
Jun |
0.0566 |
Oct |
0.2142 |
| Mar |
0.2851 |
Jul |
0.0935 |
Nov |
0.0904 |
| Apr |
0.1229 |
Aug |
0.2043 |
Dec |
0.0000 |
Wastewater Interconnections
| Water System |
PWSID |
Type |
Average Daily Amount |
Contract
Maximum (MGD) |
| MGD |
Days Used |
| Wilson |
04-98-010 |
Discharging |
0.1604 |
366 |
|
Wastewater, which contained considerable I&I in 2024, is pumped to Town of Black Creek, who then discharges to Wilson for Treatment. Wilson Receives combined flow from BC & Lucama. Billing is from Wilson. Wilson reports to have received no wastewater from Lucama because it only receives it indirectly through Black Creek. 5. Planning
Projections
| |
2024 |
2030 |
2040 |
2050 |
2060 |
2070 |
| Year-Round Population |
862 |
834 |
787 |
742 |
700 |
660 |
| Seasonal Population |
0 |
0 |
0 |
0 |
0 |
0 |
| |
| Residential |
0.0444 |
0.0430 |
0.0405 |
0.0381 |
0.0359 |
0.0338 |
| Commercial |
0.0000 |
0.0000 |
0.0000 |
0.0000 |
0.0000 |
0.0000 |
| Industrial |
0.0000 |
0.0000 |
0.0000 |
0.0000 |
0.0000 |
0.0000 |
| Institutional |
0.0000 |
0.0000 |
0.0000 |
0.0000 |
0.0000 |
0.0000 |
| System Process |
0.0090 |
0.0095 |
0.0100 |
0.0100 |
0.0105 |
0.0105 |
| Unaccounted-for |
0.0192 |
0.0189 |
0.0182 |
0.0173 |
0.0167 |
0.0159 |
Population based on a negative 0.65% annual growth rate (2020-2010 census data). Demand v/s Percent of Supply
| |
2024 |
2030 |
2040 |
2050 |
2060 |
2070 |
| Surface Water Supply |
0.0000 |
0.0000 |
0.0000 |
0.0000 |
0.0000 |
0.0000 |
| Ground Water Supply |
0.2736 |
0.2736 |
0.2736 |
0.2736 |
0.2736 |
0.2736 |
| Purchases |
0.0000 |
0.0000 |
0.0000 |
0.0000 |
0.0000 |
0.0000 |
| Future Supplies |
0.0000 |
0.0000 |
0.0000 |
0.0000 |
0.0000 |
| Total Available Supply (MGD) |
0.2736 |
0.2736 |
0.2736 |
0.2736 |
0.2736 |
0.2736 |
| Service Area Demand |
0.0726 |
0.0714 |
0.0687 |
0.0654 |
0.0631 |
0.0602 |
| Sales |
0.0000 |
0.0000 |
0.0000 |
0.0000 |
0.0000 |
0.0000 |
| Future Sales |
0.0000 |
0.0000 |
0.0000 |
0.0000 |
0.0000 |
| Total Demand (MGD) |
0.0726 |
0.0714 |
0.0687 |
0.0654 |
0.0631 |
0.0602 |
| Demand as Percent of Supply |
27% |
26% |
25% |
24% |
23% |
22% |

The purpose of the above chart is to show a general indication of how the long-term per capita water demand changes over time. The per capita water demand may actually be different than indicated due to seasonal populations and the accuracy of data submitted. Water systems that have calculated long-term per capita water demand based on a methodology that produces different results may submit their information in the notes field.
Your long-term water demand is 52 gallons per capita per day. What demand management practices do you plan to implement to reduce the per capita water demand (i.e. conduct regular water audits, implement a plumbing retrofit program, employ practices such as rainwater harvesting or reclaimed water)? If these practices are covered elsewhere in your plan, indicate where the practices are discussed here.
No Changes.
Are there other demand management practices you will implement to reduce your future supply needs? No Changes.
What supplies other than the ones listed in future supplies are being considered to meet your future supply needs? None.
How does the water system intend to implement the demand management and supply planning components above? N/A
Additional Information
Has this system participated in regional water supply or water use planning? No
What major water supply reports or studies were used for planning?
Please describe any other needs or issues regarding your water supply sources, any water system deficiencies or needed improvements (storage, treatment, etc.) or your ability to meet present and future water needs. Include both quantity and quality considerations, as well as financial, technical, managerial, permitting, and compliance issues: None.
The Division of Water Resources (DWR) provides the data contained within this
Local Water Supply Plan (LWSP) as a courtesy and service to our customers.
DWR staff does not field verify data. Neither DWR, nor any other party
involved in the preparation of this LWSP attests that the data is completely
free of errors and omissions. Furthermore, data users are cautioned that
LWSPs labeled PROVISIONAL have yet to be reviewed by DWR staff. Subsequent
review may result in significant revision. Questions regarding the accuracy
or limitations of usage of this data should be directed to the water system
and/or DWR.
|