|
The Division of Water Resources (DWR) provides the data contained within this
Local Water Supply Plan (LWSP) as a courtesy and service to our customers.
DWR staff does not field verify data. Neither DWR, nor any other party
involved in the preparation of this LWSP attests that the data is completely
free of errors and omissions. Furthermore, data users are cautioned that
LWSPs labeled PROVISIONAL have yet to be reviewed by DWR staff. Subsequent
review may result in significant revision. Questions regarding the accuracy
or limitations of usage of this data should be directed to the water system
and/or DWR.
1. System Information
Contact Information
Complete
| Water System Name: |
Piedmont Triad Regional Water Authority |
|
PWSID: |
30-76-010 |
| Mailing Address: | P.O. Box 1326
Randleman, NC 27317 | Ownership: | Authority |
| |
| Contact Person: | Greg Flory | Title: | Executive Director |
| Phone: | 336-498-5510 | Cell/Mobile: | 336-517-9139 |
| |
| Secondary Contact: | Rebecca Brown | | Phone: | 336-498-5510 |
| Mailing Address: | P.O. Box 1326
Randleman, NC 27317 | Cell/Mobile: | 336-517-9139 |
Distribution System
| Line Type |
Size Range (Inches) |
Estimated % of lines |
| Ductile Iron |
18-48 |
100.00 % |
Programs
Water Conservation
2. Water Use Information
Service Area
| Sub-Basin(s) | % of Service Population |
|---|
| Haw River (02-1) | 53 % |
| Deep River (02-2) | 47 % |
|
| County(s) | % of Service Population |
|---|
| Guilford | 75 % |
| Randolph | 25 % |
|
We do not directly serve any customers, all water is sold to other water systems who distribute it to end users, therefore; we do not have a population that is directly served by our system. Water Use by Type
| Type of Use |
Metered
Connections |
Metered
Average Use (MGD) |
Non-Metered
Connections |
Non-Metered
Estimated Use (MGD) |
| Residential |
0 |
0.0000 |
0 |
0.0000 |
| Commercial |
0 |
0.0000 |
0 |
0.0000 |
| Industrial |
0 |
0.0000 |
0 |
0.0000 |
| Institutional |
0 |
0.0000 |
0 |
0.0000 |
How much water was used for system processes (backwash, line cleaning, flushing, etc.)? 0.6610 MGD
All water produced is sold to other public water systems who then distribute it to end users, we have no data on the type of usage as we have no direct customers other than the public water systems we supply. Water Sales
| Purchaser |
PWSID |
Average
Daily Sold
(MGD) |
Days
Used |
Contract |
Required to
comply with water
use restrictions? |
Pipe Size(s)
(Inches) |
Use
Type |
| MGD |
Expiration |
Recurring |
| Archdale |
02-76-030 |
0.9380 |
365 |
1.5590 |
2057 |
Yes |
Yes |
18 |
Regular |
| Greensboro |
02-41-010 |
6.9200 |
365 |
7.8300 |
2057 |
Yes |
Yes |
48 |
Regular |
| High Point |
02-41-020 |
2.7690 |
365 |
2.7800 |
2057 |
Yes |
Yes |
24 |
Regular |
| Jamestown |
02-41-030 |
0.0000 |
365 |
0.1500 |
2057 |
Yes |
Yes |
12 |
Regular |
| Randleman |
02-76-015 |
0.4710 |
365 |
1.0000 |
2057 |
Yes |
Yes |
24 |
Regular |
Based on contract information provided by Greensboro, Greensboro currently has an allocation to purchase 7.83 MGD from PTRWA. 3. Water Supply Sources
Monthly Withdrawals & Purchases
|
Average Daily
Use (MGD) |
Max Day
Use (MGD) |
|
Average Daily
Use (MGD) |
Max Day
Use (MGD) |
|
Average Daily
Use (MGD) |
Max Day
Use (MGD) |
| Jan |
11.7340 |
12.3670 |
May |
11.7700 |
13.0080 |
Sep |
12.4240 |
13.2770 |
| Feb |
11.9230 |
13.2300 |
Jun |
12.2950 |
13.9670 |
Oct |
12.5600 |
13.9710 |
| Mar |
11.8720 |
12.8900 |
Jul |
12.5680 |
14.2110 |
Nov |
11.6090 |
12.6080 |
| Apr |
11.8990 |
12.6760 |
Aug |
12.4920 |
15.6960 |
Dec |
11.5880 |
12.5120 |

Surface Water Sources
| Stream |
Reservoir |
Average Daily Withdrawal |
Maximum Day
Withdrawal (MGD) |
Available Raw
Water Supply |
Usable On-Stream
Raw Water Supply
Storage (MG) |
| MGD |
Days Used |
MGD |
* Qualifier |
| Deep River |
Randleman Regional Reservoir |
12.0610 |
365 |
15.6960 |
54.0000 |
SY50 |
22,000.0000 |
* Qualifier: C=Contract Amount, SY20=20-year Safe Yield, SY50=50-year Safe Yield, F=20% of 7Q10 or other instream flow requirement, CUA=Capacity Use Area Permit
Surface Water Sources (continued)
| Stream |
Reservoir |
Drainage Area
(sq mi) |
Metered? |
Sub-Basin |
County |
Year
Offline |
Use
Type |
| Deep River |
Randleman Regional Reservoir |
171 |
Yes |
Deep River (02-2) |
Randolph |
|
Regular |
We have a minimum permit required downstream flow requirement of 30 cfs as measured downstream from Randleman Lake Dam, this is maintained on a daily basis. Reductions in the flow requirement are allowed under certain drought conditions.
PTRWA is authorized to transfer 30.5 MGD out of the Deep River Basin to the Haw and Yadkin River Basins. The water that is sold to Greensboro is transferred to the Haw River Basin (28.5 MGD ultimate transfer allocation and a portion of the water delivered to High Point may be transferred to the Yadkin River Basin (2.0 MGD ultimtate transfer allocation. Water Treatment Plants
| Plant Name |
Permitted Capacity
(MGD) |
Is Raw Water Metered? |
Is Finished Water Ouput Metered? |
Source |
| John F. Kime Water Treatment P |
14.7000 |
Yes |
Yes |
Randleman Regional Reservoir |
PTRWA is solely a water wholesaler and 100% of our production capacity is allocated to our partners on a daily basis, we do not typically experience significant peak demands given the structure of our water sales contracts. 4. Wastewater Information
Monthly Discharges
|
Average Daily
Discharge (MGD) |
|
Average Daily
Discharge (MGD) |
|
Average Daily
Discharge (MGD) |
| Jan |
0.6310 |
May |
0.5740 |
Sep |
1.0790 |
| Feb |
0.6210 |
Jun |
0.8640 |
Oct |
1.1020 |
| Mar |
0.6500 |
Jul |
0.9440 |
Nov |
1.2060 |
| Apr |
0.6320 |
Aug |
0.9750 |
Dec |
1.0950 |
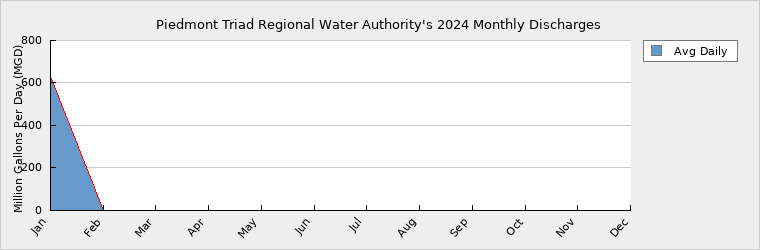
Wastewater discharge is solely for process water from the water treatment facility and sludge dewatering operations, there is no domestic component. PTRWA has completed the Basis of Design Report for a water treatment plant expansion and is working to complete a report for the addition of advanced treatment to address emerging contaminants. The water treatment plant expansion and emerging contaminant treatment will necessitate improvements in the wastewater treatment process. Final design for the expansion are expected to be completed in 2025 and for the advanced treatment in 2026 with construction of each phase beginning upon approval of construction permits by the regulatory agencies. Wastewater Permits
| Permit Number |
Type |
Permitted Capacity
(MGD) |
Design Capacity
(MGD) |
Average Annual
Daily Discharge
(MGD) |
Maximum Day Discharge
(MGD) |
Receiving Stream |
Receiving Basin |
| NC0087866 |
WTP |
2.0000 |
0.0000 |
0.8640 |
1.4280 |
Randleman Regional Reservoir |
Deep River (02-2) |
An average monthly discharge limit was instituted with our most recent permit renewal based on an internal policy that DEQ decided to begin implementing, this discharge limit is not based on any apparent design capacity and was determined by previous flow data. A design capacity has not been evaluated and determined for the wastewater treatment facility. 5. Planning
Projections
| |
2024 |
2030 |
2040 |
2050 |
2060 |
2070 |
| Year-Round Population |
0 |
0 |
0 |
0 |
0 |
0 |
| Seasonal Population |
0 |
0 |
0 |
0 |
0 |
0 |
| |
| Residential |
0.0000 |
0.0000 |
0.0000 |
0.0000 |
0.0000 |
0.0000 |
| Commercial |
0.0000 |
0.0000 |
0.0000 |
0.0000 |
0.0000 |
0.0000 |
| Industrial |
0.0000 |
0.0000 |
0.0000 |
0.0000 |
0.0000 |
0.0000 |
| Institutional |
0.0000 |
0.0000 |
0.0000 |
0.0000 |
0.0000 |
0.0000 |
| System Process |
0.6610 |
2.0000 |
3.0000 |
5.0000 |
5.0000 |
5.0000 |
| Unaccounted-for |
0.2993 |
0.0000 |
0.0000 |
0.0000 |
0.0000 |
0.0000 |
PTRWA does not directly serve any customers, all water produced is sold directly to other public water systems who deliver water to the end users, the water systems PTRWA provides water to report population and water use projections in their water supply plans. Any expansions to the PTRWA water system will be as a result of requests from the systems served for additional water up to their contractually allocated percent of the reservoir capacity. PTRWA anticipates future WTP expansions up to a 48 MGD finished water capacity, with the timing to be based upon the demands in the member's water systems. Above estimates for our system's process water and unaccounted for water take expansions into account. The next expansion is currently predicted to break ground in 2025 with completion slated for 2027, design for the expansion is currently underway. Future Water Sales
| Purchaser |
PWSID |
Contract |
Pipe Size(s) (Inches) |
Use Type |
| MGD |
Year Begin |
Year End |
| Asheboro |
02-76-010 |
1.2500 |
2026 |
|
|
Regular |
| Greensboro |
02-41-010 |
10.6800 |
2030 |
|
|
Regular |
| Greensboro |
02-41-010 |
10.6800 |
2040 |
|
|
Regular |
| Greensboro |
02-41-010 |
10.6800 |
2050 |
|
|
Regular |
Future Supply Sources
| Source Name |
PWSID |
Source Type |
Additional Supply |
Year Online |
Year Offline |
Type |
| Piedmont Triad Regional Water Authority |
30-76-010 |
Surface |
12.0000 |
2027 |
|
Regular |
PTRWA is in the process of planning for an expansion to the existing surface water treatment plant to an expected finished water capacity of 26.7 MGD. Engineering planning and preparation of a Basis of Design Report have been completed and a Design Build Contract for expansion of the water treatment facility was signed in June of 2024. The expansion is expected to progress to 60 percent design with a Guaranteed Maximum Price by the summer of 2025 at which point it will be decided if expansion will proceed at this time. The design build contract also includes the design of advanced treatment for the removal of PFAS and 1,4 Dioxane. It is expected the the advanced treatment design will progress to 60 percent design and a guaranteed maximum price by the fall of 2026 with construction to begin in late 2026. Demand v/s Percent of Supply
| |
2024 |
2030 |
2040 |
2050 |
2060 |
2070 |
| Surface Water Supply |
54.0000 |
54.0000 |
54.0000 |
54.0000 |
54.0000 |
54.0000 |
| Ground Water Supply |
0.0000 |
0.0000 |
0.0000 |
0.0000 |
0.0000 |
0.0000 |
| Purchases |
0.0000 |
0.0000 |
0.0000 |
0.0000 |
0.0000 |
0.0000 |
| Future Supplies |
12.0000 |
12.0000 |
12.0000 |
12.0000 |
12.0000 |
| Total Available Supply (MGD) |
54.0000 |
66.0000 |
66.0000 |
66.0000 |
66.0000 |
66.0000 |
| Service Area Demand |
0.9603 |
2.0000 |
3.0000 |
5.0000 |
5.0000 |
5.0000 |
| Sales |
11.0677 |
13.3190 |
13.3190 |
13.3190 |
13.3190 |
13.3190 |
| Future Sales |
11.9300 |
22.6100 |
33.2900 |
33.2900 |
33.2900 |
| Total Demand (MGD) |
12.0280 |
27.2490 |
38.9290 |
51.6090 |
51.6090 |
51.6090 |
| Demand as Percent of Supply |
22% |
41% |
59% |
78% |
78% |
78% |

The purpose of the above chart is to show a general indication of how the long-term per capita water demand changes over time. The per capita water demand may actually be different than indicated due to seasonal populations and the accuracy of data submitted. Water systems that have calculated long-term per capita water demand based on a methodology that produces different results may submit their information in the notes field.
Your long-term water demand is unavailable until we receive population data for 2024 gallons per capita per day. What demand management practices do you plan to implement to reduce the per capita water demand (i.e. conduct regular water audits, implement a plumbing retrofit program, employ practices such as rainwater harvesting or reclaimed water)? If these practices are covered elsewhere in your plan, indicate where the practices are discussed here.
As our only customers are solely other public water systems we do not plan to implement any plans to reduce future water supply needs, plans for demand management would need to be implemented by the systems that we provide water to.
Are there other demand management practices you will implement to reduce your future supply needs? As our only customers are solely other public water systems we do not plan to implement any plans to reduce future water supply needs, plans for demand management would need to be implemented by the systems that we provide water to.
What supplies other than the ones listed in future supplies are being considered to meet your future supply needs? None
How does the water system intend to implement the demand management and supply planning components above? N/A
Additional Information
Has this system participated in regional water supply or water use planning? Yes, PTRWA is comprised of 6 local governments and was formed to assist these localities in meeting their water supply needs for at least the next 50 years, therefore; by definition PTRWA is a regional water supply and was formed as a result of a regional planning effort. PTRWA has began a master planning initiative that is studying water and wastewater capacity needs in the Guilford and Randolph County region through at least the 2050 planning period. The master plan will make recommendations on initiatives that utilities in the area could make to meet the needs of the region in the most cost effective manner through the planning period.
What major water supply reports or studies were used for planning? PTRWA conducted several exhaustive studies during the formation and creation of the dam and water treatment plant including a detailed comprehensive environmental impact statement required as part of the reservoir permitting process. PTRWA actively monitored the Deep River water and wastewater capacity study that was performed on behalf of the NC Legislature by the Department of Environmental Quality to determine how this could impact long-term regionalization planning. As the next step in analyzing the Deep River Capacity Study PTRWA has began a master planning initiative that is studying water and wastewater capacity needs in the Guilford and Randolph County region through at least the 2050 planning period. The master plan will make recommendations on initiatives that utilities in the area could make to meet the needs of the region in the most cost effective manner through the planning period.
Please describe any other needs or issues regarding your water supply sources, any water system deficiencies or needed improvements (storage, treatment, etc.) or your ability to meet present and future water needs. Include both quantity and quality considerations, as well as financial, technical, managerial, permitting, and compliance issues: PTRWA is working on the design of an advance treatment facility to address PFAS and 1,4 Dioxane constituents in the source water, the cost of this treatment system will be in excess of $100,000,000 and PTRWA is working to obtain financing options that will have the least impact on our ratepayers.
PTRWA is aware that wastewater capacity may soon become a limiting factor to growth in the region. PTRWA is working as a regional facilitator to encourage cooperative relationships to address the challenge of meeting the long-term wastewater needs expected in the region, this is being closely examined as part of the master planning initiative that PTRWA is currently undertaking on behalf of the citizens in Guilford and Randolph County.
The Division of Water Resources (DWR) provides the data contained within this
Local Water Supply Plan (LWSP) as a courtesy and service to our customers.
DWR staff does not field verify data. Neither DWR, nor any other party
involved in the preparation of this LWSP attests that the data is completely
free of errors and omissions. Furthermore, data users are cautioned that
LWSPs labeled PROVISIONAL have yet to be reviewed by DWR staff. Subsequent
review may result in significant revision. Questions regarding the accuracy
or limitations of usage of this data should be directed to the water system
and/or DWR.
|