|
The Division of Water Resources (DWR) provides the data contained within this
Local Water Supply Plan (LWSP) as a courtesy and service to our customers.
DWR staff does not field verify data. Neither DWR, nor any other party
involved in the preparation of this LWSP attests that the data is completely
free of errors and omissions. Furthermore, data users are cautioned that
LWSPs labeled PROVISIONAL have yet to be reviewed by DWR staff. Subsequent
review may result in significant revision. Questions regarding the accuracy
or limitations of usage of this data should be directed to the water system
and/or DWR.
1. System Information
Contact Information
Provisional
| Water System Name: |
Pender County Utilities |
|
PWSID: |
70-71-011 |
| Mailing Address: | P O Box 995
Burgaw, NC 28425 | Ownership: | District |
| |
| Contact Person: | Anthony Colon | Title: | Utilities Executive Director |
| Phone: | 910-259-0212 | Cell/Mobile: | -- |
| |
| Secondary Contact: | Amy Cox | | Phone: | 910-515-6868 |
| Mailing Address: | PO Box 995
Burgaw, NC 28425 | Cell/Mobile: | -- |
Distribution System
| Line Type |
Size Range (Inches) |
Estimated % of lines |
| Ductile Iron |
2-16 |
5.00 % |
| Polyvinyl Chloride |
2-16 |
95.00 % |
Programs
As technicians ride throughout the system they look for leaks. Quarterly the Pender County Fire Department does fire hydrant flushing. Water Conservation
2. Water Use Information
Service Area
| Sub-Basin(s) | % of Service Population |
|---|
| Northeast Cape Fear River (02-5) | 64 % |
| New River (02-6) | 22 % |
| South River (02-4) | 12 % |
| Cape Fear River (02-3) | 2 % |
|
| County(s) | % of Service Population |
|---|
| Pender | 100 % |
|
All PCU GIS information goes through our IT Department.
Josh Norwood ([email protected]) Water Use by Type
| Type of Use |
Metered
Connections |
Metered
Average Use (MGD) |
Non-Metered
Connections |
Non-Metered
Estimated Use (MGD) |
| Residential |
11,076 |
1.3937 |
0 |
0.0000 |
| Commercial |
435 |
0.2558 |
0 |
0.0000 |
| Industrial |
10 |
0.0343 |
0 |
0.0000 |
| Institutional |
12 |
0.0248 |
0 |
0.0000 |
How much water was used for system processes (backwash, line cleaning, flushing, etc.)? 0.0283 MGD
System processes include Backwash and GAC Backwash Water Sales
| Purchaser |
PWSID |
Average
Daily Sold
(MGD) |
Days
Used |
Contract |
Required to
comply with water
use restrictions? |
Pipe Size(s)
(Inches) |
Use
Type |
| MGD |
Expiration |
Recurring |
| Belvedere |
04-71-111 |
0.0000 |
0 |
|
|
|
No |
|
Emergency |
| Topsail Beach |
04-71-020 |
0.0000 |
0 |
|
|
|
No |
|
Emergency |
| Town of Burgaw |
04-71-010 |
0.0000 |
0 |
|
|
|
No |
|
Emergency |
| Town of Surf City |
04-71-015 |
0.0000 |
0 |
|
|
|
No |
|
Emergency |
| Town of Wallace |
04-31-010 |
0.0000 |
0 |
|
|
|
No |
|
Emergency |
3. Water Supply Sources
Monthly Withdrawals & Purchases
|
Average Daily
Use (MGD) |
Max Day
Use (MGD) |
|
Average Daily
Use (MGD) |
Max Day
Use (MGD) |
|
Average Daily
Use (MGD) |
Max Day
Use (MGD) |
| Jan |
2.4441 |
|
May |
2.7528 |
|
Sep |
2.6380 |
|
| Feb |
2.4100 |
|
Jun |
3.1707 |
|
Oct |
2.6227 |
|
| Mar |
2.1533 |
|
Jul |
3.0162 |
|
Nov |
2.3750 |
|
| Apr |
2.5634 |
|
Aug |
2.8072 |
|
Dec |
2.4329 |
|

Ground Water Sources
| Name or Number |
Average Daily Withdrawal (MGD) |
Max Day Withdrawal (MGD) |
12-Hour Supply
(MGD) |
CUA Reduction |
Year Offline |
Use Type |
| MGD |
Days Used |
| Well #4 Kiwanis |
0.1970 |
244 |
|
0.2520 |
|
|
Regular |
| Well #5 Scotts Hill |
0.2003 |
8 |
|
0.2520 |
|
|
Regular |
| well #6 Annex |
0.2731 |
360 |
|
0.2520 |
|
|
Regular |
| Well #7 Hampstead/Topsail |
0.0873 |
24 |
|
0.1656 |
|
|
Regular |
| Well #8 Hoover Road |
0.2623 |
223 |
|
0.2520 |
|
|
Regular |
Ground Water Sources (continued)
| Name or Number |
Well Depth (Feet) |
Casing Depth
(Feet) |
Screen Depth (Feet) |
Well Diameter (Inches) |
Pump Intake Depth (Feet) |
Metered? |
| Top |
Bottom |
| Well #4 Kiwanis |
287 |
257 |
257 |
287 |
8 |
185 |
Yes |
| Well #5 Scotts Hill |
220 |
170 |
170 |
215 |
10 |
165 |
Yes |
| well #6 Annex |
237 |
207 |
207 |
237 |
8 |
185 |
Yes |
| Well #7 Hampstead/Topsail |
232 |
195 |
195 |
227 |
10 |
184 |
Yes |
| Well #8 Hoover Road |
208 |
171 |
171 |
203 |
10 |
164 |
Yes |
Water Purchases From Other Systems
| Seller |
PWSID |
Average
Daily Purchased
(MGD) |
Days
Used |
Contract |
Required to
comply with water
use restrictions? |
Pipe Size(s)
(Inches) |
Use
Type |
| MGD |
Expiration |
Recurring |
| Lower Cape Fear Water and Sewer Authority |
50-09-013 |
1.6582 |
366 |
6.0000 |
2029 |
Yes |
Yes |
54 |
Regular |
| Town of Wallace |
04-31-010 |
0.3293 |
366 |
1.2000 |
2040 |
Yes |
Yes |
2-10 |
Regular |
Water Treatment Plants
| Plant Name |
Permitted Capacity
(MGD) |
Is Raw Water Metered? |
Is Finished Water Ouput Metered? |
Source |
| Pender County Utilities SWTP |
4.0000 |
Yes |
Yes |
Purchase Raw water from LCFWASA - Cape Fear River |
4. Wastewater Information
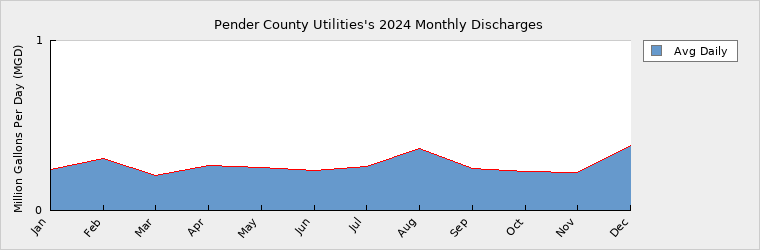
Monthly Discharges
|
Average Daily
Discharge (MGD) |
|
Average Daily
Discharge (MGD) |
|
Average Daily
Discharge (MGD) |
| Jan |
0.2403 |
May |
0.2529 |
Sep |
0.2493 |
| Feb |
0.3069 |
Jun |
0.2340 |
Oct |
0.2281 |
| Mar |
0.2071 |
Jul |
0.2581 |
Nov |
0.2237 |
| Apr |
0.2650 |
Aug |
0.3619 |
Dec |
0.3834 |
Adding Force Main and Lift Station Wastewater Permits
| Permit Number |
Type |
Permitted Capacity
(MGD) |
Design Capacity
(MGD) |
Average Annual
Daily Discharge
(MGD) |
Maximum Day Discharge
(MGD) |
Receiving Stream |
Receiving Basin |
| NC0081736 |
WWTP |
0.5000 |
1.0000 |
0.1229 |
0.1900 |
Cape Fear River |
Cape Fear River (02-3) |
| WQ0020849 |
CS |
0.2500 |
0.2500 |
0.0000 |
|
Cape Fear River |
Cape Fear River (02-3) |
Wastewater collected under permit WQ0020849 is accounted for through the interconnection with CFPUA. Wastewater Interconnections
| Water System |
PWSID |
Type |
Average Daily Amount |
Contract
Maximum (MGD) |
| MGD |
Days Used |
| Cape Fear Public Utility Authority |
04-65-010 |
Discharging |
0.0360 |
366 |
0.2500 |
5. Planning
Projections
| |
2024 |
2030 |
2040 |
2050 |
2060 |
2070 |
| Year-Round Population |
31,600 |
33,544 |
37,054 |
40,525 |
44,321 |
48,474 |
| Seasonal Population |
0 |
0 |
0 |
0 |
0 |
0 |
| |
| Residential |
1.3937 |
1.4794 |
1.6341 |
1.7871 |
1.9545 |
2.1376 |
| Commercial |
0.2558 |
0.2713 |
0.2996 |
0.3277 |
0.3584 |
0.3902 |
| Industrial |
0.0343 |
0.0343 |
0.0343 |
0.0343 |
0.0343 |
0.0343 |
| Institutional |
0.0248 |
0.0263 |
0.0290 |
0.0318 |
0.0348 |
0.0380 |
| System Process |
0.0283 |
0.0300 |
0.0331 |
0.0362 |
0.0395 |
0.0432 |
| Unaccounted-for |
0.8205 |
0.8701 |
0.9593 |
1.0477 |
1.1443 |
1.2491 |
Future Water Sales
| Purchaser |
PWSID |
Contract |
Pipe Size(s) (Inches) |
Use Type |
| MGD |
Year Begin |
Year End |
| Belvedere |
04-71-111 |
0.4000 |
2050 |
|
|
Regular |
| Burgaw |
04-71-010 |
0.8000 |
2050 |
|
|
Regular |
| Surf City |
04-71-015 |
0.3000 |
2050 |
|
|
Regular |
| Topsail Beach |
04-71-020 |
0.1000 |
2050 |
|
|
Regular |
| Wallace |
04-31-010 |
0.2000 |
2050 |
|
|
Regular |
The future sales are included in the LWSP in accordance with the Pender County IBT. The demand could be needed before 2050 and is based on needs of the individual water systems. Future Supply Sources
| Source Name |
PWSID |
Source Type |
Additional Supply |
Year Online |
Year Offline |
Type |
| Brunswick County Water System |
04-10-045 |
Purchase |
5.0000 |
2027 |
|
Regular |
Demand v/s Percent of Supply
| |
2024 |
2030 |
2040 |
2050 |
2060 |
2070 |
| Surface Water Supply |
0.0000 |
0.0000 |
0.0000 |
0.0000 |
0.0000 |
0.0000 |
| Ground Water Supply |
1.1736 |
1.1736 |
1.1736 |
1.1736 |
1.1736 |
1.1736 |
| Purchases |
7.2000 |
7.2000 |
7.2000 |
7.2000 |
7.2000 |
7.2000 |
| Future Supplies |
5.0000 |
5.0000 |
5.0000 |
5.0000 |
5.0000 |
| Total Available Supply (MGD) |
8.3736 |
13.3736 |
13.3736 |
13.3736 |
13.3736 |
13.3736 |
| Service Area Demand |
2.5574 |
2.7114 |
2.9894 |
3.2648 |
3.5658 |
3.8924 |
| Sales |
0.0000 |
0.0000 |
0.0000 |
0.0000 |
0.0000 |
0.0000 |
| Future Sales |
0.0000 |
0.0000 |
1.8000 |
1.8000 |
1.8000 |
| Total Demand (MGD) |
2.5574 |
2.7114 |
2.9894 |
5.0648 |
5.3658 |
5.6924 |
| Demand as Percent of Supply |
31% |
20% |
22% |
38% |
40% |
43% |

The purpose of the above chart is to show a general indication of how the long-term per capita water demand changes over time. The per capita water demand may actually be different than indicated due to seasonal populations and the accuracy of data submitted. Water systems that have calculated long-term per capita water demand based on a methodology that produces different results may submit their information in the notes field.
Your long-term water demand is 44 gallons per capita per day. What demand management practices do you plan to implement to reduce the per capita water demand (i.e. conduct regular water audits, implement a plumbing retrofit program, employ practices such as rainwater harvesting or reclaimed water)? If these practices are covered elsewhere in your plan, indicate where the practices are discussed here.
Are there other demand management practices you will implement to reduce your future supply needs?
What supplies other than the ones listed in future supplies are being considered to meet your future supply needs?
How does the water system intend to implement the demand management and supply planning components above? The demand to supply ratio inthe Lower Cape Fear Water and Sewer Authority (LCFWSA)-Kings Bluff Local Water Supply Plan (LWSP) is currently above 80% because the available raw water supply is fully allocated to the existing customers and partners (Brunswick County, Cape Fear Public Utility Authority, and Pender County). Based on a 7Q10 calculation, the total available supply for the system is 106 MGD at Lock and Dam No. 1. Even so, the currently projected demands of all partners- when totaled remain below 80% of the available raw water supply for the foressable future (2070). Futhermore, all the partners have agreed no to exceed the demands currently projected in their LWSP, without notice to NCDWR, even though these amounts may remain less than what LCFWSA - King's Bluff is obligated to supply ration in the LCFWSA Kings' Bluff LWSP exceeds 80%, a long term water supply plan to address future demands whould be needed per statutory requirements, before NCDWR could approve LWSP
Additional Information
Has this system participated in regional water supply or water use planning? Yes, Yes, with (6) other local water purveyors as Co-Applicants, Pender County Utilities was able to secure a 14.5 MGD IBT Certificate on October 19, 2018.
What major water supply reports or studies were used for planning? Environmental Assessment and Hydrologic Modeling.
Please describe any other needs or issues regarding your water supply sources, any water system deficiencies or needed improvements (storage, treatment, etc.) or your ability to meet present and future water needs. Include both quantity and quality considerations, as well as financial, technical, managerial, permitting, and compliance issues: The Division of Water Resources (DWR) provides the data contained within the Local Water Supply Plan (LWSP) as a courtesy and service to our customers. DWR staff does not field verify data. Neither DWR, nor any other party involved in the preparation of this LWSP attests that the data is completely free of errors and omissions. Furthermore, data users are cautioned that LWSPs labeled PROVISIONAL have yet to be reviewed by DWR staff. Subsequent review may result in significant revision. Questions regarding the accuracy or limitations of usage of this data should be directed to the water system and/or DWR.
The Division of Water Resources (DWR) provides the data contained within this
Local Water Supply Plan (LWSP) as a courtesy and service to our customers.
DWR staff does not field verify data. Neither DWR, nor any other party
involved in the preparation of this LWSP attests that the data is completely
free of errors and omissions. Furthermore, data users are cautioned that
LWSPs labeled PROVISIONAL have yet to be reviewed by DWR staff. Subsequent
review may result in significant revision. Questions regarding the accuracy
or limitations of usage of this data should be directed to the water system
and/or DWR.
|