|
The Division of Water Resources (DWR) provides the data contained within this
Local Water Supply Plan (LWSP) as a courtesy and service to our customers.
DWR staff does not field verify data. Neither DWR, nor any other party
involved in the preparation of this LWSP attests that the data is completely
free of errors and omissions. Furthermore, data users are cautioned that
LWSPs labeled PROVISIONAL have yet to be reviewed by DWR staff. Subsequent
review may result in significant revision. Questions regarding the accuracy
or limitations of usage of this data should be directed to the water system
and/or DWR.
1. System Information
Contact Information
Complete
| Water System Name: |
Sugar Mountain |
|
PWSID: |
01-06-107 |
| Mailing Address: | PO Box 240908
Charlotte, NC 28224 | Ownership: | Business |
| |
| Contact Person: | Harshna Patel | Title: | Water Quality Coordinator |
| Phone: | 704-608-4974 | Cell/Mobile: | -- |
Distribution System
| Line Type |
Size Range (Inches) |
Estimated % of lines |
| Ductile Iron |
4-16 |
94.00 % |
| Polyvinyl Chloride |
2-6 |
6.00 % |
revised estimated water lines. Programs
The company's water accountability program tracks pumpage, known water loss (from system processes, identified leaks, etc.) and water sold to determine monthly unaccounted for water loss. The installed AMR meters data helps to monitor and analyze usage, troubleshoot issues like leaks in timely manner. This assist in decreasing of non-revenue water.
Our company website provides resources on water conservation and guides on reading water meters and detecting leaks. Water Efficiency Rebate Program is also promoted via our website to help customers offset the cost of installing high-efficiency appliances. Additionally Annual Consumer Confidence Report includes tips on reducing nonessential water use and promoting water conservation. Water Conservation
Banner Elk's water line is approximately 3 miles away and at a substantially lower elevation, making it difficult to achieve the water pressure
necessary to serve Sugar Mountain.
Ski Country water system is closest to the system for emergency circumstances. 2. Water Use Information
Service Area
| Sub-Basin(s) | % of Service Population |
|---|
| Watauga River (16-1) | 100 % |
|
| County(s) | % of Service Population |
|---|
| Avery | 100 % |
|
Sugar Mountain is a winter ski resort with approximately 20% of the residents living there year round. Based on the winter usage, the highest influx of
customers occurs Nov/Dec to March. However, because all customers are charged at least a base charge each month of the year, it is difficult to
calculate a seasonal population. Population is based on the water connections (less irrigation) multiplied by 2.24 which is the average persons per household in Avery County per the US Census Bureau for 2020-2024. Water Use by Type
| Type of Use |
Metered
Connections |
Metered
Average Use (MGD) |
Non-Metered
Connections |
Non-Metered
Estimated Use (MGD) |
| Residential |
1,313 |
0.0715 |
0 |
0.0000 |
| Commercial |
97 |
0.0464 |
0 |
0.0000 |
| Industrial |
0 |
0.0000 |
0 |
0.0000 |
| Institutional |
0 |
0.0000 |
0 |
0.0000 |
How much water was used for system processes (backwash, line cleaning, flushing, etc.)? 0.0116 MGD
3. Water Supply Sources
Monthly Withdrawals & Purchases
|
Average Daily
Use (MGD) |
Max Day
Use (MGD) |
|
Average Daily
Use (MGD) |
Max Day
Use (MGD) |
|
Average Daily
Use (MGD) |
Max Day
Use (MGD) |
| Jan |
0.3056 |
0.3807 |
May |
0.1616 |
0.1846 |
Sep |
0.1633 |
0.2004 |
| Feb |
0.3062 |
0.3461 |
Jun |
0.1896 |
0.2344 |
Oct |
0.1736 |
0.2241 |
| Mar |
0.1961 |
0.3081 |
Jul |
0.2115 |
0.2874 |
Nov |
0.1602 |
0.2149 |
| Apr |
0.1635 |
0.1990 |
Aug |
0.1792 |
0.2060 |
Dec |
0.2236 |
0.3299 |

Ground Water Sources
| Name or Number |
Average Daily Withdrawal (MGD) |
Max Day Withdrawal (MGD) |
12-Hour Supply
(MGD) |
CUA Reduction |
Year Offline |
Use Type |
| MGD |
Days Used |
| 01 |
0.0136 |
319 |
0.0324 |
0.0936 |
|
|
Regular |
| 02 |
0.0048 |
365 |
0.0088 |
0.0245 |
|
|
Regular |
| 03 |
0.0096 |
346 |
0.0204 |
0.0202 |
|
|
Regular |
| 04 |
0.0152 |
363 |
0.0376 |
0.0382 |
|
|
Regular |
| 05 |
0.0134 |
355 |
0.0285 |
0.0245 |
|
|
Regular |
| 06 |
0.0000 |
0 |
0 |
0.0403 |
|
|
Emergency |
| 07 |
0.0035 |
362 |
0.0104 |
0.0238 |
|
|
Regular |
| 08 |
0.0027 |
362 |
0.00784 |
0.0180 |
|
|
Regular |
| 09 |
0.0250 |
356 |
0.0295 |
0.0403 |
|
|
Regular |
| 10 |
0.0076 |
347 |
0.0416 |
0.0864 |
|
|
Regular |
| 11 |
0.0032 |
353 |
0.0179 |
0.0317 |
|
|
Regular |
| 12 |
0.0060 |
357 |
0.0166 |
0.0245 |
|
|
Regular |
| 13 |
0.0068 |
357 |
0.0198 |
0.0223 |
|
|
Regular |
| 14 |
0.0118 |
359 |
0.0679 |
0.0900 |
|
|
Regular |
| 16 |
0.0094 |
364 |
0.0244 |
0.0338 |
|
|
Regular |
| 17 |
0.0123 |
364 |
0.0285 |
0.0310 |
|
|
Regular |
| 18 |
0.0103 |
360 |
0.0301 |
0.0202 |
|
|
Regular |
| 19 |
0.0123 |
365 |
0.0348 |
0.0353 |
|
|
Regular |
| 19A |
0.0125 |
365 |
0.0361 |
0.0410 |
|
|
Regular |
| 20 |
0.0154 |
365 |
0.0366 |
0.0792 |
|
|
Regular |
| 21 |
0.0039 |
341 |
0.0107 |
0.0194 |
|
|
Regular |
| 22 |
0.0082 |
341 |
0.0254 |
0.0331 |
|
|
Regular |
| 23 |
0.0000 |
0 |
0 |
0.0295 |
|
|
Emergency |
| 24 |
0.0000 |
0 |
0 |
0.0900 |
|
2023 |
Regular |
Ground Water Sources (continued)
| Name or Number |
Well Depth (Feet) |
Casing Depth
(Feet) |
Screen Depth (Feet) |
Well Diameter (Inches) |
Pump Intake Depth (Feet) |
Metered? |
| Top |
Bottom |
| 01 |
260 |
40 |
|
|
6 |
178 |
Yes |
| 02 |
300 |
55 |
|
|
6 |
273 |
Yes |
| 03 |
215 |
60 |
|
|
6 |
197 |
Yes |
| 04 |
205 |
59 |
|
|
6 |
197 |
Yes |
| 05 |
240 |
|
|
|
6 |
147 |
Yes |
| 06 |
300 |
|
|
|
6 |
273 |
Yes |
| 07 |
320 |
41 |
|
|
6 |
315 |
Yes |
| 08 |
250 |
20 |
|
|
6 |
230 |
Yes |
| 09 |
275 |
|
|
|
6 |
236 |
Yes |
| 10 |
500 |
|
|
|
6 |
483 |
Yes |
| 11 |
600 |
82 |
|
|
6 |
315 |
Yes |
| 12 |
500 |
51 |
|
|
6 |
336 |
Yes |
| 13 |
500 |
|
|
|
6 |
232 |
Yes |
| 14 |
400 |
78 |
|
|
6 |
378 |
Yes |
| 16 |
600 |
29 |
|
|
|
504 |
Yes |
| 17 |
600 |
49 |
|
|
6 |
531 |
Yes |
| 18 |
400 |
48 |
|
|
6 |
357 |
Yes |
| 19 |
600 |
|
|
|
6 |
478 |
Yes |
| 19A |
900 |
8 |
|
|
|
315 |
Yes |
| 20 |
600 |
|
|
|
6 |
252 |
Yes |
| 21 |
600 |
90 |
|
|
6 |
420 |
Yes |
| 22 |
600 |
60 |
|
|
6 |
420 |
Yes |
| 23 |
800 |
50 |
|
|
8 |
498 |
Yes |
| 24 |
1080 |
82 |
|
|
8 |
777 |
Yes |
4. Wastewater Information
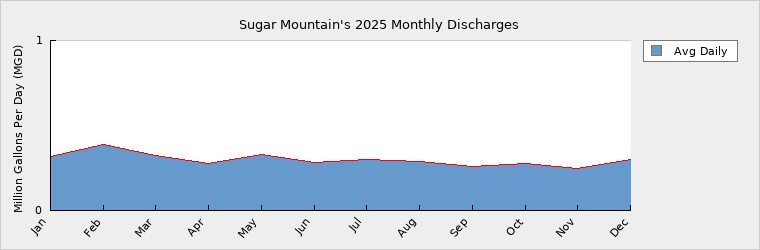
Monthly Discharges
|
Average Daily
Discharge (MGD) |
|
Average Daily
Discharge (MGD) |
|
Average Daily
Discharge (MGD) |
| Jan |
0.3175 |
May |
0.3285 |
Sep |
0.2614 |
| Feb |
0.3889 |
Jun |
0.2820 |
Oct |
0.2764 |
| Mar |
0.3244 |
Jul |
0.3026 |
Nov |
0.2497 |
| Apr |
0.2765 |
Aug |
0.2855 |
Dec |
0.3023 |
Wastewater Permits
| Permit Number |
Type |
Permitted Capacity
(MGD) |
Design Capacity
(MGD) |
Average Annual
Daily Discharge
(MGD) |
Maximum Day Discharge
(MGD) |
Receiving Stream |
Receiving Basin |
| NC0022900 |
WWTP |
1.0000 |
0.5000 |
0.2996 |
1.6840 |
Flattop Creek |
Watauga River (16-1) |
5. Planning
Projections
| |
2025 |
2030 |
2040 |
2050 |
2060 |
2070 |
| Year-Round Population |
3,143 |
3,162 |
3,181 |
3,200 |
3,219 |
3,239 |
| Seasonal Population |
0 |
0 |
0 |
0 |
0 |
0 |
| |
| Residential |
0.0715 |
0.0719 |
0.0723 |
0.0728 |
0.0732 |
0.0737 |
| Commercial |
0.0464 |
0.0465 |
0.0466 |
0.0467 |
0.0468 |
0.0469 |
| Industrial |
0.0000 |
0.0000 |
0.0000 |
0.0000 |
0.0000 |
0.0000 |
| Institutional |
0.0000 |
0.0000 |
0.0000 |
0.0000 |
0.0000 |
0.0000 |
| System Process |
0.0116 |
0.0116 |
0.0116 |
0.0116 |
0.0116 |
0.0116 |
| Unaccounted-for |
0.0727 |
0.0736 |
0.0742 |
0.0749 |
0.0756 |
0.0763 |
Demand v/s Percent of Supply
| |
2025 |
2030 |
2040 |
2050 |
2060 |
2070 |
| Surface Water Supply |
0.0000 |
0.0000 |
0.0000 |
0.0000 |
0.0000 |
0.0000 |
| Ground Water Supply |
0.9210 |
0.8310 |
0.8310 |
0.8310 |
0.8310 |
0.8310 |
| Purchases |
0.0000 |
0.0000 |
0.0000 |
0.0000 |
0.0000 |
0.0000 |
| Future Supplies |
0.0000 |
0.0000 |
0.0000 |
0.0000 |
0.0000 |
| Total Available Supply (MGD) |
0.9210 |
0.8310 |
0.8310 |
0.8310 |
0.8310 |
0.8310 |
| Service Area Demand |
0.2022 |
0.2036 |
0.2047 |
0.2060 |
0.2072 |
0.2085 |
| Sales |
0.0000 |
0.0000 |
0.0000 |
0.0000 |
0.0000 |
0.0000 |
| Future Sales |
0.0000 |
0.0000 |
0.0000 |
0.0000 |
0.0000 |
| Total Demand (MGD) |
0.2022 |
0.2036 |
0.2047 |
0.2060 |
0.2072 |
0.2085 |
| Demand as Percent of Supply |
22% |
25% |
25% |
25% |
25% |
25% |

The purpose of the above chart is to show a general indication of how the long-term per capita water demand changes over time. The per capita water demand may actually be different than indicated due to seasonal populations and the accuracy of data submitted. Water systems that have calculated long-term per capita water demand based on a methodology that produces different results may submit their information in the notes field.
Your long-term water demand is 23 gallons per capita per day. What demand management practices do you plan to implement to reduce the per capita water demand (i.e. conduct regular water audits, implement a plumbing retrofit program, employ practices such as rainwater harvesting or reclaimed water)? If these practices are covered elsewhere in your plan, indicate where the practices are discussed here.
No Changes
Are there other demand management practices you will implement to reduce your future supply needs? We continue to use the annual Consumer Confidence Report and our website to promote water conservation and Water Efficiency Rebate
Program. AMR meters installed helps in troubleshooting non-revenue issues. We will do leak studies as needed to help with unaccounted water.
What supplies other than the ones listed in future supplies are being considered to meet your future supply needs? We will evaluate current and historical water usage patterns and seek future well sites to develop for demand increase in the system.
How does the water system intend to implement the demand management and supply planning components above? We would pursue engineering design and state approval for any changes to our water supply
Additional Information
Has this system participated in regional water supply or water use planning? No
What major water supply reports or studies were used for planning?
Please describe any other needs or issues regarding your water supply sources, any water system deficiencies or needed improvements (storage, treatment, etc.) or your ability to meet present and future water needs. Include both quantity and quality considerations, as well as financial, technical, managerial, permitting, and compliance issues:
The Division of Water Resources (DWR) provides the data contained within this
Local Water Supply Plan (LWSP) as a courtesy and service to our customers.
DWR staff does not field verify data. Neither DWR, nor any other party
involved in the preparation of this LWSP attests that the data is completely
free of errors and omissions. Furthermore, data users are cautioned that
LWSPs labeled PROVISIONAL have yet to be reviewed by DWR staff. Subsequent
review may result in significant revision. Questions regarding the accuracy
or limitations of usage of this data should be directed to the water system
and/or DWR.
|