|
The Division of Water Resources (DWR) provides the data contained within this
Local Water Supply Plan (LWSP) as a courtesy and service to our customers.
DWR staff does not field verify data. Neither DWR, nor any other party
involved in the preparation of this LWSP attests that the data is completely
free of errors and omissions. Furthermore, data users are cautioned that
LWSPs labeled PROVISIONAL have yet to be reviewed by DWR staff. Subsequent
review may result in significant revision. Questions regarding the accuracy
or limitations of usage of this data should be directed to the water system
and/or DWR.
1. System Information
Contact Information
Complete
| Water System Name: |
Fairfield Sapphire |
|
PWSID: |
01-50-113 |
| Mailing Address: | P.O. Box 240908
Charlotte, NC 28224 | Ownership: | Business |
| |
| Contact Person: | Harshna Patel | Title: | Water Quality Coordinator |
| Phone: | 704-608-4974 | Cell/Mobile: | -- |
Distribution System
| Line Type |
Size Range (Inches) |
Estimated % of lines |
| Ductile Iron |
2-12 |
19.74 % |
| Other |
1.5-2 |
0.14 % |
| Polyvinyl Chloride |
2-12 |
80.12 % |
Programs
Water Conservation
There are no water systems nearby to establish an interconnect. 2. Water Use Information
Service Area
| Sub-Basin(s) | % of Service Population |
|---|
| Savannah River (08-1) | 100 % |
|
| County(s) | % of Service Population |
|---|
| Jackson | 90 % |
| Transylvania | 10 % |
|
Population is based on the water connections (less irrigation) multiplied by 2.16, the average persons per household in Jackson County, NC per the
US Census Bureau for 2020-2024.
Approximately 50% of the residents live in the area year round. Peak months being holiday times and during summer months. However, because all
customers are charged at least a base charge each month of the year, it is difficult to calculate a seasonal population. Water Use by Type
| Type of Use |
Metered
Connections |
Metered
Average Use (MGD) |
Non-Metered
Connections |
Non-Metered
Estimated Use (MGD) |
| Residential |
1,755 |
0.1347 |
0 |
0.0000 |
| Commercial |
57 |
0.0286 |
0 |
0.0000 |
| Industrial |
0 |
0.0000 |
0 |
0.0000 |
| Institutional |
0 |
0.0000 |
0 |
0.0000 |
How much water was used for system processes (backwash, line cleaning, flushing, etc.)? 0.0553 MGD
In response to unaccounted-for-water (UFW) levels for Fairfield Sapphire, we are actively working to reduce the water loss. Our action items are outlined below, and we will provide updates on the progress as items are addressed.
2026 Actions Planned:
Replacing approximately 700 linear feet of water main on Buckberry Drive. This is an area in which frequent leaks have occurred in the past.
Schedule McKim and Creed for further leak detection services. Work is expected to begin on May 4th.
Plans to replace source meters.
We have previously taken the steps listed below to address water loss. However, the system's elevated location and vast layout make it difficult to pinpoint and resolve issues immediately.
2014: Performed helium leak detection for the entire water system. A few small leaks were identified and repaired.
2016: Replaced all river crossings with HDPE and new valves
2016: Replaced meters in the entire system with Sensus AMR meters
2019 – 2025: Utilized McKim and Creed for leak detection services encompassing 16 miles of main. These efforts identified 6 leaks resulting in a loss of 107 gpm, all of which were repaired. 3. Water Supply Sources
Monthly Withdrawals & Purchases
|
Average Daily
Use (MGD) |
Max Day
Use (MGD) |
|
Average Daily
Use (MGD) |
Max Day
Use (MGD) |
|
Average Daily
Use (MGD) |
Max Day
Use (MGD) |
| Jan |
0.3702 |
0.5458 |
May |
0.3390 |
0.4823 |
Sep |
0.4330 |
0.5548 |
| Feb |
0.3680 |
0.5085 |
Jun |
0.4039 |
0.5584 |
Oct |
0.4170 |
0.5947 |
| Mar |
0.3648 |
0.5012 |
Jul |
0.4444 |
0.5294 |
Nov |
0.3185 |
0.5217 |
| Apr |
0.3539 |
0.5875 |
Aug |
0.4928 |
0.8335 |
Dec |
0.3051 |
0.5939 |

Ground Water Sources
| Name or Number |
Average Daily Withdrawal (MGD) |
Max Day Withdrawal (MGD) |
12-Hour Supply
(MGD) |
CUA Reduction |
Year Offline |
Use Type |
| MGD |
Days Used |
| Well #1 |
0.0483 |
365 |
0.1508 |
0.0400 |
|
|
Regular |
| Well #10 |
0.0168 |
281 |
0.0340 |
0.0250 |
|
|
Regular |
| Well #12 |
0.0604 |
359 |
0.1193 |
0.0580 |
|
|
Regular |
| Well #2 |
0.0653 |
364 |
0.1299 |
0.0920 |
|
|
Regular |
| Well #3 |
0.0491 |
364 |
0.1426 |
0.0610 |
|
|
Regular |
| Well #4 |
0.0499 |
361 |
0.1384 |
0.0650 |
|
|
Regular |
| Well #5 |
0.0000 |
0 |
0 |
0.0490 |
|
|
Regular |
| Well #6 |
0.0000 |
0 |
0 |
0.0430 |
|
|
Regular |
| Well #7 |
0.0450 |
365 |
0.1365 |
0.0480 |
|
|
Regular |
| Well #8 |
0.0669 |
297 |
0.1484 |
0.1220 |
|
|
Regular |
| Well #9 |
0.0438 |
8 |
0.1484 |
0.0500 |
|
|
Regular |
Ground Water Sources (continued)
| Name or Number |
Well Depth (Feet) |
Casing Depth
(Feet) |
Screen Depth (Feet) |
Well Diameter (Inches) |
Pump Intake Depth (Feet) |
Metered? |
| Top |
Bottom |
| Well #1 |
|
|
|
|
|
|
Yes |
| Well #10 |
900 |
56 |
|
|
6 |
537 |
Yes |
| Well #12 |
750 |
68 |
|
|
8 |
357 |
Yes |
| Well #2 |
|
|
|
|
|
|
Yes |
| Well #3 |
|
|
|
|
|
|
Yes |
| Well #4 |
|
|
|
|
|
|
Yes |
| Well #5 |
|
|
|
|
|
|
Yes |
| Well #6 |
|
|
|
|
|
|
Yes |
| Well #7 |
|
|
|
|
|
|
Yes |
| Well #8 |
585 |
50 |
|
|
|
384 |
Yes |
| Well #9 |
505 |
|
|
|
|
441 |
Yes |
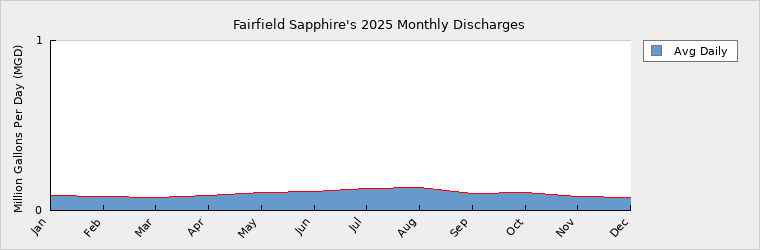
4. Wastewater Information
Monthly Discharges
|
Average Daily
Discharge (MGD) |
|
Average Daily
Discharge (MGD) |
|
Average Daily
Discharge (MGD) |
| Jan |
0.0905 |
May |
0.1031 |
Sep |
0.0989 |
| Feb |
0.0818 |
Jun |
0.1091 |
Oct |
0.1049 |
| Mar |
0.0753 |
Jul |
0.1305 |
Nov |
0.0808 |
| Apr |
0.0894 |
Aug |
0.1373 |
Dec |
0.0762 |
We plan to expand the wastewater treatment plant to the permitted capacity of 0.80 mgd when needed for system expansion.
Wastewater Permits
| Permit Number |
Type |
Permitted Capacity
(MGD) |
Design Capacity
(MGD) |
Average Annual
Daily Discharge
(MGD) |
Maximum Day Discharge
(MGD) |
Receiving Stream |
Receiving Basin |
| NC0022985 |
WWTP |
0.8000 |
0.3000 |
0.0981 |
0.3990 |
Trays Island Creek |
Savannah River (08-1) |
5. Planning
Projections
| |
2025 |
2030 |
2040 |
2050 |
2060 |
2070 |
| Year-Round Population |
3,873 |
3,883 |
3,894 |
3,904 |
3,914 |
3,925 |
| Seasonal Population |
0 |
0 |
0 |
0 |
0 |
0 |
| |
| Residential |
0.1347 |
0.1350 |
0.1354 |
0.1357 |
0.1361 |
0.1364 |
| Commercial |
0.0286 |
0.0288 |
0.0290 |
0.0292 |
0.0294 |
0.0297 |
| Industrial |
0.0000 |
0.0000 |
0.0000 |
0.0000 |
0.0000 |
0.0000 |
| Institutional |
0.0000 |
0.0000 |
0.0000 |
0.0000 |
0.0000 |
0.0000 |
| System Process |
0.0553 |
0.0553 |
0.0553 |
0.0553 |
0.0553 |
0.0553 |
| Unaccounted-for |
0.1659 |
0.1663 |
0.1668 |
0.1672 |
0.1677 |
0.1681 |
Demand v/s Percent of Supply
| |
2025 |
2030 |
2040 |
2050 |
2060 |
2070 |
| Surface Water Supply |
0.0000 |
0.0000 |
0.0000 |
0.0000 |
0.0000 |
0.0000 |
| Ground Water Supply |
0.6530 |
0.6530 |
0.6530 |
0.6530 |
0.6530 |
0.6530 |
| Purchases |
0.0000 |
0.0000 |
0.0000 |
0.0000 |
0.0000 |
0.0000 |
| Future Supplies |
0.0000 |
0.0000 |
0.0000 |
0.0000 |
0.0000 |
| Total Available Supply (MGD) |
0.6530 |
0.6530 |
0.6530 |
0.6530 |
0.6530 |
0.6530 |
| Service Area Demand |
0.3845 |
0.3854 |
0.3865 |
0.3874 |
0.3885 |
0.3895 |
| Sales |
0.0000 |
0.0000 |
0.0000 |
0.0000 |
0.0000 |
0.0000 |
| Future Sales |
0.0000 |
0.0000 |
0.0000 |
0.0000 |
0.0000 |
| Total Demand (MGD) |
0.3845 |
0.3854 |
0.3865 |
0.3874 |
0.3885 |
0.3895 |
| Demand as Percent of Supply |
59% |
59% |
59% |
59% |
59% |
60% |

The purpose of the above chart is to show a general indication of how the long-term per capita water demand changes over time. The per capita water demand may actually be different than indicated due to seasonal populations and the accuracy of data submitted. Water systems that have calculated long-term per capita water demand based on a methodology that produces different results may submit their information in the notes field.
Your long-term water demand is 35 gallons per capita per day. What demand management practices do you plan to implement to reduce the per capita water demand (i.e. conduct regular water audits, implement a plumbing retrofit program, employ practices such as rainwater harvesting or reclaimed water)? If these practices are covered elsewhere in your plan, indicate where the practices are discussed here.
No changes
Are there other demand management practices you will implement to reduce your future supply needs? We continue to use the annual Consumer Confidence Report and our website to promote water conservation and Water Efficiency Rebate Program. AMR meters installed helps in troubleshooting non-revenue issues. We will do leak studies as needed to help with unaccounted water.
What supplies other than the ones listed in future supplies are being considered to meet your future supply needs? Well 13, 68 GPM is available for use. We will evaluate current and historical water usage patterns and seek future well sites to develop for demand increase in the system.
How does the water system intend to implement the demand management and supply planning components above? We would pursue engineering design and state approval for any changes to our water supply.
Additional Information
Has this system participated in regional water supply or water use planning? No
What major water supply reports or studies were used for planning?
Please describe any other needs or issues regarding your water supply sources, any water system deficiencies or needed improvements (storage, treatment, etc.) or your ability to meet present and future water needs. Include both quantity and quality considerations, as well as financial, technical, managerial, permitting, and compliance issues:
The Division of Water Resources (DWR) provides the data contained within this
Local Water Supply Plan (LWSP) as a courtesy and service to our customers.
DWR staff does not field verify data. Neither DWR, nor any other party
involved in the preparation of this LWSP attests that the data is completely
free of errors and omissions. Furthermore, data users are cautioned that
LWSPs labeled PROVISIONAL have yet to be reviewed by DWR staff. Subsequent
review may result in significant revision. Questions regarding the accuracy
or limitations of usage of this data should be directed to the water system
and/or DWR.
|