|
The Division of Water Resources (DWR) provides the data contained within this
Local Water Supply Plan (LWSP) as a courtesy and service to our customers.
DWR staff does not field verify data. Neither DWR, nor any other party
involved in the preparation of this LWSP attests that the data is completely
free of errors and omissions. Furthermore, data users are cautioned that
LWSPs labeled PROVISIONAL have yet to be reviewed by DWR staff. Subsequent
review may result in significant revision. Questions regarding the accuracy
or limitations of usage of this data should be directed to the water system
and/or DWR.
1. System Information
Contact Information
Complete
| Water System Name: |
Lincoln County |
|
PWSID: |
01-55-035 |
| Mailing Address: | 115 West Main Street
Lincolnton, NC 28092 | Ownership: | County |
| |
| Contact Person: | Jonathan Drazenovich | Title: | County Engineer |
| Phone: | 704-736-8495 | Cell/Mobile: | -- |
| |
| Secondary Contact: | John D Hawkins | | Phone: | 704-736-8495 |
| Mailing Address: | 115 W. Main Street
Lincolnton, NC 28092 | Cell/Mobile: | -- |
Distribution System
| Line Type |
Size Range (Inches) |
Estimated % of lines |
| Asbestos Cement |
6-8 |
1.12 % |
| Ductile Iron |
3-24 |
9.07 % |
| Galvanized Iron |
1.5-2 |
0.06 % |
| Other |
2-16 |
0.05 % |
| Polyvinyl Chloride |
2-12 |
89.70 % |
Decrease in miles of waterline is due to change of ownership with the City and corrections of duplicate lines in the GIS system. Programs
Water Conservation
2. Water Use Information
Service Area
| Sub-Basin(s) | % of Service Population |
|---|
| Catawba River (03-1) | 75 % |
| South Fork Catawba River (03-2) | 25 % |
|
| County(s) | % of Service Population |
|---|
| Lincoln | 97 % |
| Catawba | 2 % |
| Gaston | 1 % |
|
Population Served is based on number of domestic* residential connections multiplied by 2.55 persons per household. Irrigation connections were separated from the calculation for the 2025 year resulting in a lower population served than previous years. Water Use by Type
| Type of Use |
Metered
Connections |
Metered
Average Use (MGD) |
Non-Metered
Connections |
Non-Metered
Estimated Use (MGD) |
| Residential |
17,728 |
2.4620 |
0 |
0.0000 |
| Commercial |
986 |
0.4480 |
45 |
0.0022 |
| Industrial |
97 |
0.2750 |
32 |
0.0144 |
| Institutional |
86 |
0.1760 |
5 |
0.0088 |
How much water was used for system processes (backwash, line cleaning, flushing, etc.)? 0.4219 MGD
Non Meter Accounts (fire services) were not captured in previous years bulk data pulls.
A high number of zero read accounts were identified and are under assessment and repair.
A fire protection system has been identified with a significant leak/leaks we are working with the industries to find and repair leaks in the system. County is also proposing to add metering at this location to more accurately capture consumption.
The county is working with local fire departments and has developed a mobile application to capture fire flow losses during testing /flushing. Water Sales
| Purchaser |
PWSID |
Average
Daily Sold
(MGD) |
Days
Used |
Contract |
Required to
comply with water
use restrictions? |
Pipe Size(s)
(Inches) |
Use
Type |
| MGD |
Expiration |
Recurring |
| High Shoals |
01-36-075 |
0.0500 |
365 |
0.1000 |
2025 |
Yes |
Yes |
12 |
Regular |
| Lincolnton |
01-55-010 |
0.0000 |
0 |
1.0000 |
2030 |
Yes |
Yes |
12 |
Emergency |
3. Water Supply Sources
Monthly Withdrawals & Purchases
|
Average Daily
Use (MGD) |
Max Day
Use (MGD) |
|
Average Daily
Use (MGD) |
Max Day
Use (MGD) |
|
Average Daily
Use (MGD) |
Max Day
Use (MGD) |
| Jan |
3.9654 |
5.0105 |
May |
4.5325 |
5.7949 |
Sep |
5.2360 |
6.2702 |
| Feb |
3.8175 |
3.8363 |
Jun |
4.8215 |
6.1266 |
Oct |
5.0366 |
5.9478 |
| Mar |
3.9463 |
4.2817 |
Jul |
5.6675 |
6.4664 |
Nov |
4.1073 |
4.8667 |
| Apr |
4.3121 |
4.9166 |
Aug |
4.9786 |
5.9657 |
Dec |
3.7688 |
4.5063 |

Surface Water Sources
| Stream |
Reservoir |
Average Daily Withdrawal |
Maximum Day
Withdrawal (MGD) |
Available Raw
Water Supply |
Usable On-Stream
Raw Water Supply
Storage (MG) |
| MGD |
Days Used |
MGD |
* Qualifier |
| Catawba River |
Lake Norman |
3.6278 |
365 |
4.5237 |
7.1000 |
C |
12.0000 |
* Qualifier: C=Contract Amount, SY20=20-year Safe Yield, SY50=50-year Safe Yield, F=20% of 7Q10 or other instream flow requirement, CUA=Capacity Use Area Permit
Surface Water Sources (continued)
| Stream |
Reservoir |
Drainage Area
(sq mi) |
Metered? |
Sub-Basin |
County |
Year
Offline |
Use
Type |
| Catawba River |
Lake Norman |
1,790 |
Yes |
Catawba River (03-1) |
Lincoln |
|
Regular |
Water Purchases From Other Systems
| Seller |
PWSID |
Average
Daily Purchased
(MGD) |
Days
Used |
Contract |
Required to
comply with water
use restrictions? |
Pipe Size(s)
(Inches) |
Use
Type |
| MGD |
Expiration |
Recurring |
| Lincolnton |
01-55-010 |
0.8880 |
365 |
2.8000 |
2030 |
Yes |
Yes |
12, 8 |
Regular |
Water Treatment Plants
| Plant Name |
Permitted Capacity
(MGD) |
Is Raw Water Metered? |
Is Finished Water Ouput Metered? |
Source |
| Lake Norman WTP |
8.0000 |
Yes |
Yes |
Lake Norman |
4. Wastewater Information
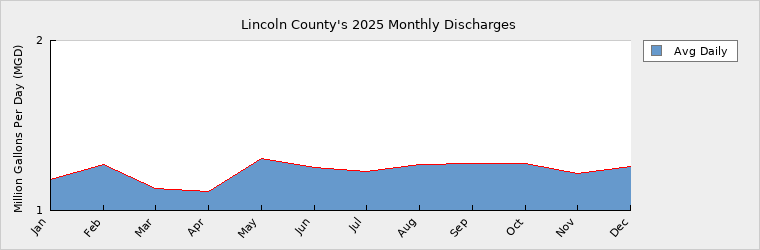
Monthly Discharges
|
Average Daily
Discharge (MGD) |
|
Average Daily
Discharge (MGD) |
|
Average Daily
Discharge (MGD) |
| Jan |
1.1820 |
May |
1.3050 |
Sep |
1.2780 |
| Feb |
1.2680 |
Jun |
1.2510 |
Oct |
1.2770 |
| Mar |
1.1300 |
Jul |
1.2310 |
Nov |
1.2200 |
| Apr |
1.1100 |
Aug |
1.2730 |
Dec |
1.2600 |
Wastewater Permits
| Permit Number |
Type |
Permitted Capacity
(MGD) |
Design Capacity
(MGD) |
Average Annual
Daily Discharge
(MGD) |
Maximum Day Discharge
(MGD) |
Receiving Stream |
Receiving Basin |
| NC0088722 |
WWTP |
6.6000 |
6.6000 |
1.2320 |
1.8950 |
Killian Creek |
Catawba River (03-1) |
5. Planning
Projections
| |
2025 |
2030 |
2040 |
2050 |
2060 |
2070 |
| Year-Round Population |
38,530 |
40,894 |
45,258 |
50,311 |
52,663 |
61,416 |
| Seasonal Population |
0 |
0 |
0 |
0 |
0 |
0 |
| |
| Residential |
2.4620 |
2.6172 |
2.8965 |
3.2199 |
3.3704 |
3.9306 |
| Commercial |
0.4502 |
0.5182 |
0.5780 |
0.6375 |
0.7115 |
0.7783 |
| Industrial |
0.2894 |
0.3590 |
0.4004 |
0.4417 |
0.4929 |
0.5392 |
| Institutional |
0.1848 |
0.2037 |
0.2272 |
0.2506 |
0.2797 |
0.3059 |
| System Process |
0.4219 |
0.5381 |
0.6001 |
0.6620 |
0.7387 |
0.8081 |
| Unaccounted-for |
0.6575 |
0.7292 |
0.7874 |
0.8971 |
1.0011 |
1.0951 |
Updated data on 4/1/2026 an error was identified in the spreadsheet that compounded the percentage of population growth. Causing numbers to be much higher than they should. Demand v/s Percent of Supply
| |
2025 |
2030 |
2040 |
2050 |
2060 |
2070 |
| Surface Water Supply |
7.1000 |
7.1000 |
7.1000 |
7.1000 |
7.1000 |
7.1000 |
| Ground Water Supply |
0.0000 |
0.0000 |
0.0000 |
0.0000 |
0.0000 |
0.0000 |
| Purchases |
2.8000 |
2.8000 |
2.8000 |
2.8000 |
2.8000 |
2.8000 |
| Future Supplies |
0.0000 |
0.0000 |
0.0000 |
0.0000 |
0.0000 |
| Total Available Supply (MGD) |
9.9000 |
9.9000 |
9.9000 |
9.9000 |
9.9000 |
9.9000 |
| Service Area Demand |
4.4658 |
4.9654 |
5.4896 |
6.1088 |
6.5943 |
7.4572 |
| Sales |
0.0500 |
0.1000 |
0.1000 |
0.1000 |
0.1000 |
0.1000 |
| Future Sales |
0.0000 |
0.0000 |
0.0000 |
0.0000 |
0.0000 |
| Total Demand (MGD) |
4.5158 |
5.0654 |
5.5896 |
6.2088 |
6.6943 |
7.5572 |
| Demand as Percent of Supply |
46% |
51% |
56% |
63% |
68% |
76% |

The purpose of the above chart is to show a general indication of how the long-term per capita water demand changes over time. The per capita water demand may actually be different than indicated due to seasonal populations and the accuracy of data submitted. Water systems that have calculated long-term per capita water demand based on a methodology that produces different results may submit their information in the notes field.
Your long-term water demand is 64 gallons per capita per day. What demand management practices do you plan to implement to reduce the per capita water demand (i.e. conduct regular water audits, implement a plumbing retrofit program, employ practices such as rainwater harvesting or reclaimed water)? If these practices are covered elsewhere in your plan, indicate where the practices are discussed here.
Zero read accounts have been identified and are being investigated. Discussions on voluntary irrigation reduction through alternate address requirements for irrigation systems are underway. There is also plans to distribute literature on water conservation through reduction of irrigation. We currently have higher water demand due to irrigation during summer months.
Are there other demand management practices you will implement to reduce your future supply needs?
What supplies other than the ones listed in future supplies are being considered to meet your future supply needs?
How does the water system intend to implement the demand management and supply planning components above?
Additional Information
Has this system participated in regional water supply or water use planning? Yes, Yes, Lincoln County participates in the Catawba Wateree Management Group.
What major water supply reports or studies were used for planning? The Intergrated Water Resource Plan Additional information can be found at the following address.
https://catawbawatereewmg.org/our-work/water-supply-master-plan
Please describe any other needs or issues regarding your water supply sources, any water system deficiencies or needed improvements (storage, treatment, etc.) or your ability to meet present and future water needs. Include both quantity and quality considerations, as well as financial, technical, managerial, permitting, and compliance issues: A project is active (under Construction) to replace aging disinfection equipment, and one is in 90% design to improve distribution in the eastern and central zones.
The Division of Water Resources (DWR) provides the data contained within this
Local Water Supply Plan (LWSP) as a courtesy and service to our customers.
DWR staff does not field verify data. Neither DWR, nor any other party
involved in the preparation of this LWSP attests that the data is completely
free of errors and omissions. Furthermore, data users are cautioned that
LWSPs labeled PROVISIONAL have yet to be reviewed by DWR staff. Subsequent
review may result in significant revision. Questions regarding the accuracy
or limitations of usage of this data should be directed to the water system
and/or DWR.
|