|
The Division of Water Resources (DWR) provides the data contained within this
Local Water Supply Plan (LWSP) as a courtesy and service to our customers.
DWR staff does not field verify data. Neither DWR, nor any other party
involved in the preparation of this LWSP attests that the data is completely
free of errors and omissions. Furthermore, data users are cautioned that
LWSPs labeled PROVISIONAL have yet to be reviewed by DWR staff. Subsequent
review may result in significant revision. Questions regarding the accuracy
or limitations of usage of this data should be directed to the water system
and/or DWR.
1. System Information
Contact Information
Complete
| Water System Name: |
East Spencer |
|
PWSID: |
01-80-060 |
| Mailing Address: | P.O. BOX 339
East Spencer, NC 28039 | Ownership: | Municipality |
| |
| Contact Person: | Barbara Mallett | Title: | Mayor |
| Phone: | 704-636-7111 | Cell/Mobile: | -- |
| |
| Secondary Contact: | Kalah Simpson | | Phone: | 704-216-2731 |
| Mailing Address: | 1 Water St
Salisbury, NC 28144 | Cell/Mobile: | -- |
Distribution System
| Line Type |
Size Range (Inches) |
Estimated % of lines |
| Asbestos Cement |
4 |
1.70 % |
| Cast Iron |
4-12 |
43.50 % |
| Ductile Iron |
3-12 |
12.10 % |
| Galvanized Iron |
.75-2 |
6.20 % |
| Polyvinyl Chloride |
1-12 |
36.50 % |
Programs
Water Conservation
2. Water Use Information
Service Area
| Sub-Basin(s) | % of Service Population |
|---|
| Yadkin River (18-1) | 100 % |
|
| County(s) | % of Service Population |
|---|
| Rowan | 100 % |
|
Population based on the number of service connections multiplied by 2.35. Irrigation, flushing, and sewer-only meters are not included in meter count for this calculation. Calculation: 832 * 2.35 = 1955 Water Use by Type
| Type of Use |
Metered
Connections |
Metered
Average Use (MGD) |
Non-Metered
Connections |
Non-Metered
Estimated Use (MGD) |
| Residential |
772 |
0.0693 |
0 |
0.0000 |
| Commercial |
28 |
0.0069 |
0 |
0.0000 |
| Industrial |
13 |
0.0189 |
0 |
0.0000 |
| Institutional |
22 |
0.0258 |
0 |
0.0000 |
How much water was used for system processes (backwash, line cleaning, flushing, etc.)? 0.0008 MGD
3. Water Supply Sources
Monthly Withdrawals & Purchases
|
Average Daily
Use (MGD) |
Max Day
Use (MGD) |
|
Average Daily
Use (MGD) |
Max Day
Use (MGD) |
|
Average Daily
Use (MGD) |
Max Day
Use (MGD) |
| Jan |
0.1524 |
0.1998 |
May |
0.1733 |
0.2842 |
Sep |
0.1824 |
0.3010 |
| Feb |
0.1496 |
0.1848 |
Jun |
0.1848 |
0.3441 |
Oct |
0.1718 |
0.1994 |
| Mar |
0.1548 |
0.1964 |
Jul |
0.1819 |
0.2136 |
Nov |
0.1756 |
0.2797 |
| Apr |
0.1577 |
0.2417 |
Aug |
0.1831 |
0.2659 |
Dec |
0.1787 |
0.2333 |

Water Purchases From Other Systems
| Seller |
PWSID |
Average
Daily Purchased
(MGD) |
Days
Used |
Contract |
Required to
comply with water
use restrictions? |
Pipe Size(s)
(Inches) |
Use
Type |
| MGD |
Expiration |
Recurring |
| Salisbury |
01-80-010 |
0.1706 |
365 |
0.5000 |
2020 |
Yes |
Yes |
8 |
Regular |
4. Wastewater Information
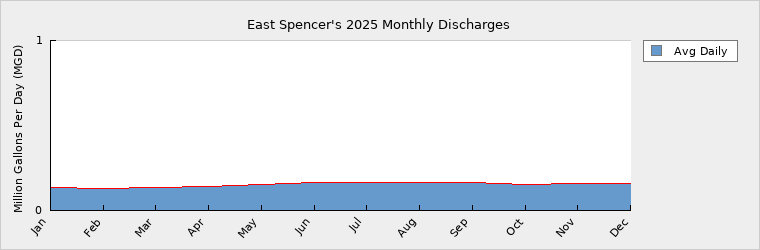
Monthly Discharges
|
Average Daily
Discharge (MGD) |
|
Average Daily
Discharge (MGD) |
|
Average Daily
Discharge (MGD) |
| Jan |
0.1336 |
May |
0.1544 |
Sep |
0.1635 |
| Feb |
0.1308 |
Jun |
0.1659 |
Oct |
0.1529 |
| Mar |
0.1360 |
Jul |
0.1631 |
Nov |
0.1567 |
| Apr |
0.1388 |
Aug |
0.1642 |
Dec |
0.1599 |
Wastewater Interconnections
| Water System |
PWSID |
Type |
Average Daily Amount |
Contract
Maximum (MGD) |
| MGD |
Days Used |
| Salisbury |
01-80-010 |
Discharging |
0.1513 |
365 |
0.5000 |
5. Planning
Projections
| |
2025 |
2030 |
2040 |
2050 |
2060 |
2070 |
| Year-Round Population |
1,955 |
1,975 |
2,014 |
2,054 |
2,095 |
2,137 |
| Seasonal Population |
0 |
0 |
0 |
0 |
0 |
0 |
| |
| Residential |
0.0693 |
0.0869 |
0.0886 |
0.0904 |
0.0922 |
0.0940 |
| Commercial |
0.0069 |
0.0071 |
0.0074 |
0.0078 |
0.0082 |
0.0086 |
| Industrial |
0.0189 |
0.0190 |
0.0192 |
0.0194 |
0.0196 |
0.0198 |
| Institutional |
0.0258 |
0.0259 |
0.0262 |
0.0265 |
0.0267 |
0.0270 |
| System Process |
0.0008 |
0.0008 |
0.0008 |
0.0008 |
0.0009 |
0.0009 |
| Unaccounted-for |
0.0489 |
0.0561 |
0.0571 |
0.0582 |
0.0593 |
0.0604 |
Population based off of the number of service taps multiplied by 2.35. Assumed 2% increase in population every 10 years.
Future years residential usage based on 44 gpcd.
Future commercial demand to increase 5% every 10 years.
Industrial demand to increase 1% every 10 years.
Institutional demand to increase 1% every 10 years.
System process to increase 2% every 10 years.
Demand v/s Percent of Supply
| |
2025 |
2030 |
2040 |
2050 |
2060 |
2070 |
| Surface Water Supply |
0.0000 |
0.0000 |
0.0000 |
0.0000 |
0.0000 |
0.0000 |
| Ground Water Supply |
0.0000 |
0.0000 |
0.0000 |
0.0000 |
0.0000 |
0.0000 |
| Purchases |
0.5000 |
0.5000 |
0.5000 |
0.5000 |
0.5000 |
0.5000 |
| Future Supplies |
0.0000 |
0.0000 |
0.0000 |
0.0000 |
0.0000 |
| Total Available Supply (MGD) |
0.5000 |
0.5000 |
0.5000 |
0.5000 |
0.5000 |
0.5000 |
| Service Area Demand |
0.1706 |
0.1958 |
0.1993 |
0.2031 |
0.2069 |
0.2107 |
| Sales |
0.0000 |
0.0000 |
0.0000 |
0.0000 |
0.0000 |
0.0000 |
| Future Sales |
0.0000 |
0.0000 |
0.0000 |
0.0000 |
0.0000 |
| Total Demand (MGD) |
0.1706 |
0.1958 |
0.1993 |
0.2031 |
0.2069 |
0.2107 |
| Demand as Percent of Supply |
34% |
39% |
40% |
41% |
41% |
42% |

The purpose of the above chart is to show a general indication of how the long-term per capita water demand changes over time. The per capita water demand may actually be different than indicated due to seasonal populations and the accuracy of data submitted. Water systems that have calculated long-term per capita water demand based on a methodology that produces different results may submit their information in the notes field.
Your long-term water demand is 35 gallons per capita per day. What demand management practices do you plan to implement to reduce the per capita water demand (i.e. conduct regular water audits, implement a plumbing retrofit program, employ practices such as rainwater harvesting or reclaimed water)? If these practices are covered elsewhere in your plan, indicate where the practices are discussed here.
Are there other demand management practices you will implement to reduce your future supply needs?
What supplies other than the ones listed in future supplies are being considered to meet your future supply needs?
How does the water system intend to implement the demand management and supply planning components above?
Additional Information
Has this system participated in regional water supply or water use planning? Yes, Yes, East Spencer is represented by the City of Salisbury as part of the Yadkin-PeeDee Water Management Group.
Salisbury completed a water system master plan as well as the creation of a new calibrated hydraulic model in calendar year 2022.
What major water supply reports or studies were used for planning? TECHNICAL REPORT: HIGH ROCK DAM AND HIGH ROCK LAKE SEDIMENTATIONFLOODING EFFECTS AS ESTIMATED USING HECRAS MODELING, City of Salisbury (SalisburyRowan Utilities), January, 2006 NUMERICALSEDIMENTATION INVESTIGATION, YADKIN RIVER, NORTH CAROLINA, Mobile Boundary Hydraulics, February, 2007 HIGH ROCK DAM AND SEDIMENTDELTA FLOODING AND
SEDIMENTATION EFFECTS (19272058) ON CITY OF SALISBURY CRITICAL INFRASTRUCTURE, Martin Doyle, February 2007 and FINALENVIRONMENTAL IMPACT STATEMENT FOR HYDROPOWER LICENSES YADKIN HYDROELECTRIC PROJECT FERC PROJECT NO. 2197073 YADKIN PEE DEE RIVER HYDROELECTRIC PROJECT FERC PROJECT NO. 2206030 NORTH CAROLINA, Federal Energy Regulatory Commission, April 2008.Reports on file with NC Division of Water Resources, Raleigh, NC.
Please describe any other needs or issues regarding your water supply sources, any water system deficiencies or needed improvements (storage, treatment, etc.) or your ability to meet present and future water needs. Include both quantity and quality considerations, as well as financial, technical, managerial, permitting, and compliance issues:
The Division of Water Resources (DWR) provides the data contained within this
Local Water Supply Plan (LWSP) as a courtesy and service to our customers.
DWR staff does not field verify data. Neither DWR, nor any other party
involved in the preparation of this LWSP attests that the data is completely
free of errors and omissions. Furthermore, data users are cautioned that
LWSPs labeled PROVISIONAL have yet to be reviewed by DWR staff. Subsequent
review may result in significant revision. Questions regarding the accuracy
or limitations of usage of this data should be directed to the water system
and/or DWR.
|