|
The Division of Water Resources (DWR) provides the data contained within this
Local Water Supply Plan (LWSP) as a courtesy and service to our customers.
DWR staff does not field verify data. Neither DWR, nor any other party
involved in the preparation of this LWSP attests that the data is completely
free of errors and omissions. Furthermore, data users are cautioned that
LWSPs labeled PROVISIONAL have yet to be reviewed by DWR staff. Subsequent
review may result in significant revision. Questions regarding the accuracy
or limitations of usage of this data should be directed to the water system
and/or DWR.
1. System Information
Contact Information
Provisional
| Water System Name: |
Kannapolis |
|
PWSID: |
01-80-065 |
| Mailing Address: | 401 Laureate Way
Kannapolis, NC 28081 | Ownership: | Municipality |
| |
| Contact Person: | Gerald Faulkner | Title: | WTP Operations Manager |
| Phone: | 704-920-4259 | Cell/Mobile: | 704-791-7787 |
Distribution System
| Line Type |
Size Range (Inches) |
Estimated % of lines |
| Asbestos Cement |
6-30 |
20.00 % |
| Cast Iron |
3-18 |
4.70 % |
| Ductile Iron |
6-30 |
13.50 % |
| Galvanized Iron |
2-3 |
12.00 % |
| Polyvinyl Chloride |
2-12 |
49.80 % |
Programs
Water Conservation
2. Water Use Information
Service Area
| Sub-Basin(s) | % of Service Population |
|---|
| Rocky River (18-4) | 100 % |
|
| County(s) | % of Service Population |
|---|
| Cabarrus | 80 % |
| Rowan | 20 % |
|
The LWSP for the CoK includes the following identification numbers. City of Kannapolis 01-80-065 and Shiloh Church 20-13-022. The population for the CoK is: 52,214, and Shiloh is: 3,836.
2024 Plan Correction: Population for the CoK was: 51,445 (corrected), and Shiloh: 3,312 Water Use by Type
| Type of Use |
Metered
Connections |
Metered
Average Use (MGD) |
Non-Metered
Connections |
Non-Metered
Estimated Use (MGD) |
| Residential |
22,067 |
2.3993 |
0 |
0.0000 |
| Commercial |
1,706 |
1.5909 |
0 |
0.0000 |
| Industrial |
0 |
0.0000 |
0 |
0.0000 |
| Institutional |
0 |
0.0000 |
0 |
0.0000 |
How much water was used for system processes (backwash, line cleaning, flushing, etc.)? 0.4690 MGD
Water Sales
| Purchaser |
PWSID |
Average
Daily Sold
(MGD) |
Days
Used |
Contract |
Required to
comply with water
use restrictions? |
Pipe Size(s)
(Inches) |
Use
Type |
| MGD |
Expiration |
Recurring |
| City of Concord |
01-13-010 |
0.1710 |
365 |
1.5000 |
2031 |
Yes |
Yes |
6-24 |
Regular |
| Town of Landis |
01-80-038 |
0.3351 |
365 |
1.0000 |
2026 |
Yes |
Yes |
12 |
Regular |
3. Water Supply Sources
Monthly Withdrawals & Purchases
|
Average Daily
Use (MGD) |
Max Day
Use (MGD) |
|
Average Daily
Use (MGD) |
Max Day
Use (MGD) |
|
Average Daily
Use (MGD) |
Max Day
Use (MGD) |
| Jan |
5.9722 |
6.7910 |
May |
6.3548 |
7.0680 |
Sep |
6.7218 |
7.3250 |
| Feb |
5.8945 |
6.4760 |
Jun |
6.7204 |
9.3110 |
Oct |
6.6353 |
7.5130 |
| Mar |
6.3939 |
7.5020 |
Jul |
7.1709 |
8.2460 |
Nov |
6.3588 |
7.2170 |
| Apr |
6.5012 |
6.9980 |
Aug |
6.6578 |
7.3290 |
Dec |
5.9010 |
6.3120 |

Surface Water Sources
| Stream |
Reservoir |
Average Daily Withdrawal |
Maximum Day
Withdrawal (MGD) |
Available Raw
Water Supply |
Usable On-Stream
Raw Water Supply
Storage (MG) |
| MGD |
Days Used |
MGD |
* Qualifier |
| Coddle Creek |
Lake Howell |
0.0000 |
0 |
0.0000 |
2.6000 |
C |
5,296.0000 |
| Irish Buffalo Creek |
Kannapolis Lake |
5.0830 |
365 |
7.9510 |
8.5000 |
SY50 |
1,100.0000 |
| Second Creek |
Stream |
0.0000 |
0 |
0.0000 |
2.5000 |
SY50 |
1.0000 |
* Qualifier: C=Contract Amount, SY20=20-year Safe Yield, SY50=50-year Safe Yield, F=20% of 7Q10 or other instream flow requirement, CUA=Capacity Use Area Permit
Surface Water Sources (continued)
| Stream |
Reservoir |
Drainage Area
(sq mi) |
Metered? |
Sub-Basin |
County |
Year
Offline |
Use
Type |
| Coddle Creek |
Lake Howell |
47 |
Yes |
Rocky River (18-4) |
Cabarrus |
|
Regular |
| Irish Buffalo Creek |
Kannapolis Lake |
11 |
Yes |
Rocky River (18-4) |
Rowan |
|
Regular |
| Second Creek |
Stream |
56 |
Yes |
South Yadkin River (18-2) |
Cabarrus |
|
Regular |
Lake Howell reservoir has a contracted usable volume for Kannapolis of 2.6 MGD by agreement between WSACC and Kannapolis. A minimum flow is required downstream of Lake Don T. Howell in Coddle Creek. Water Purchases From Other Systems
| Seller |
PWSID |
Average
Daily Purchased
(MGD) |
Days
Used |
Contract |
Required to
comply with water
use restrictions? |
Pipe Size(s)
(Inches) |
Use
Type |
| MGD |
Expiration |
Recurring |
| City of Concord |
01-13-010 |
0.5880 |
365 |
1.5000 |
2031 |
Yes |
Yes |
6-24 |
Regular |
| City of Concord |
01-13-010 |
0.7720 |
365 |
2.0000 |
2050 |
Yes |
Yes |
24 |
Regular |
| City of Salisbury |
01-80-010 |
0.0000 |
0 |
3.1000 |
2016 |
No |
Yes |
16 |
Emergency |
Concord has two contracts with Kannapolis. Our IBT that is a 2.0 MGD contract. An ongoing connection for the 1.5 MGD contract.
The required purchase contract with Salisbury expired in October 2016. The connections remain as an emergency interconnection. Water Treatment Plants
| Plant Name |
Permitted Capacity
(MGD) |
Is Raw Water Metered? |
Is Finished Water Ouput Metered? |
Source |
| City of Kannapolis WTP |
15.0000 |
Yes |
Yes |
Kannapolis Lake, Second Creek and Lake Howell |
4. Wastewater Information
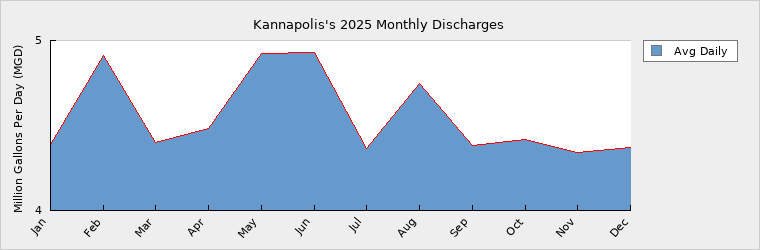
Monthly Discharges
|
Average Daily
Discharge (MGD) |
|
Average Daily
Discharge (MGD) |
|
Average Daily
Discharge (MGD) |
| Jan |
4.3860 |
May |
4.9250 |
Sep |
4.3810 |
| Feb |
4.9130 |
Jun |
4.9300 |
Oct |
4.4190 |
| Mar |
4.4020 |
Jul |
4.3620 |
Nov |
4.3390 |
| Apr |
4.4850 |
Aug |
4.7450 |
Dec |
4.3700 |
Wastewater Permits
| Permit Number |
Type |
Permitted Capacity
(MGD) |
Design Capacity
(MGD) |
Average Annual
Daily Discharge
(MGD) |
Maximum Day Discharge
(MGD) |
Receiving Stream |
Receiving Basin |
| NC0036269 |
CS |
26.5000 |
26.5000 |
21.6401 |
44.3200 |
Rocky River |
Rocky River (18-4) |
City of Kannapolis wastewater is treated through WSACC. WSACC is expanding the Rocky River WWTP. Wastewater Interconnections
| Water System |
PWSID |
Type |
Average Daily Amount |
Contract
Maximum (MGD) |
| MGD |
Days Used |
| City of Concord |
01-13-010 |
Discharging |
0.0935 |
365 |
1.5000 |
| WSACC |
01-13-999 |
Discharging |
4.5548 |
365 |
6.0890 |
Wastewater flows are based on billing. 5. Planning
Projections
| |
2025 |
2030 |
2040 |
2050 |
2060 |
2070 |
| Year-Round Population |
56,050 |
60,350 |
70,050 |
81,300 |
94,350 |
109,450 |
| Seasonal Population |
0 |
0 |
0 |
0 |
0 |
0 |
| |
| Residential |
2.3993 |
2.5830 |
2.9980 |
3.4800 |
4.0400 |
4.6800 |
| Commercial |
1.5909 |
1.6880 |
1.8900 |
2.1150 |
2.3650 |
2.6450 |
| Industrial |
0.0000 |
0.0000 |
0.0000 |
0.0000 |
0.0000 |
0.0000 |
| Institutional |
0.0000 |
0.0000 |
0.0000 |
0.0000 |
0.0000 |
0.0000 |
| System Process |
0.4690 |
0.4680 |
0.4770 |
0.4870 |
0.4970 |
0.5070 |
| Unaccounted-for |
1.4777 |
1.5704 |
1.7779 |
2.0155 |
2.2872 |
2.5954 |
Water demand projections for the City of Kannapolis were developed using the 2025 baseline data and a moderate annual population growth rate consistent with recent trends and regional planning information. Residential demand was projected to increase proportionally with population, while commercial demand was projected to grow at a slightly lower rate. Demand v/s Percent of Supply
| |
2025 |
2030 |
2040 |
2050 |
2060 |
2070 |
| Surface Water Supply |
13.6000 |
13.6000 |
13.6000 |
13.6000 |
13.6000 |
13.6000 |
| Ground Water Supply |
0.0000 |
0.0000 |
0.0000 |
0.0000 |
0.0000 |
0.0000 |
| Purchases |
3.5000 |
3.5000 |
3.5000 |
3.5000 |
3.5000 |
3.5000 |
| Future Supplies |
0.0000 |
0.0000 |
0.0000 |
0.0000 |
0.0000 |
| Total Available Supply (MGD) |
17.1000 |
17.1000 |
17.1000 |
17.1000 |
17.1000 |
17.1000 |
| Service Area Demand |
5.9369 |
6.3094 |
7.1429 |
8.0975 |
9.1892 |
10.4274 |
| Sales |
0.5061 |
2.5000 |
2.5000 |
2.5000 |
2.5000 |
2.5000 |
| Future Sales |
0.0000 |
0.0000 |
0.0000 |
0.0000 |
0.0000 |
| Total Demand (MGD) |
6.4430 |
8.8094 |
9.6429 |
10.5975 |
11.6892 |
12.9274 |
| Demand as Percent of Supply |
38% |
52% |
56% |
62% |
68% |
76% |

The purpose of the above chart is to show a general indication of how the long-term per capita water demand changes over time. The per capita water demand may actually be different than indicated due to seasonal populations and the accuracy of data submitted. Water systems that have calculated long-term per capita water demand based on a methodology that produces different results may submit their information in the notes field.
Your long-term water demand is 43 gallons per capita per day. What demand management practices do you plan to implement to reduce the per capita water demand (i.e. conduct regular water audits, implement a plumbing retrofit program, employ practices such as rainwater harvesting or reclaimed water)? If these practices are covered elsewhere in your plan, indicate where the practices are discussed here.
We are currently working on our water and sewer master plan, and this will help guide our needs and future discussions.
Are there other demand management practices you will implement to reduce your future supply needs?
What supplies other than the ones listed in future supplies are being considered to meet your future supply needs? The City of Kannapolis is evaluating a backwash recovery and recycling plan at the WTP.
How does the water system intend to implement the demand management and supply planning components above? We have an engineering firm currently working on options for this project.
Additional Information
Has this system participated in regional water supply or water use planning? Yes, Yes, WSACC Regional Water and Sewer Master Plan.
What major water supply reports or studies were used for planning? The Water and Sewer Authority of Cabarrus County Master Plan was finalized in 2024. Along with the WSACC Master Plan, the City of Kannapolis is working on updating our CIP plan and hydraulic flow model. This information will be used to develop capital projects and meet growth demands.
Please describe any other needs or issues regarding your water supply sources, any water system deficiencies or needed improvements (storage, treatment, etc.) or your ability to meet present and future water needs. Include both quantity and quality considerations, as well as financial, technical, managerial, permitting, and compliance issues: The City of Kannapolis has increased its ground-level storage capacity by 2MG this year.
The Division of Water Resources (DWR) provides the data contained within this
Local Water Supply Plan (LWSP) as a courtesy and service to our customers.
DWR staff does not field verify data. Neither DWR, nor any other party
involved in the preparation of this LWSP attests that the data is completely
free of errors and omissions. Furthermore, data users are cautioned that
LWSPs labeled PROVISIONAL have yet to be reviewed by DWR staff. Subsequent
review may result in significant revision. Questions regarding the accuracy
or limitations of usage of this data should be directed to the water system
and/or DWR.
|