|
The Division of Water Resources (DWR) provides the data contained within this
Local Water Supply Plan (LWSP) as a courtesy and service to our customers.
DWR staff does not field verify data. Neither DWR, nor any other party
involved in the preparation of this LWSP attests that the data is completely
free of errors and omissions. Furthermore, data users are cautioned that
LWSPs labeled PROVISIONAL have yet to be reviewed by DWR staff. Subsequent
review may result in significant revision. Questions regarding the accuracy
or limitations of usage of this data should be directed to the water system
and/or DWR.
1. System Information
Contact Information
Complete
| Water System Name: |
Brevard |
|
PWSID: |
01-88-010 |
| Mailing Address: | 95 West Main Street
Brevard, NC 28712 | Ownership: | Municipality |
| |
| Contact Person: | Dennis Richardson | Title: | Water Plant Superintendent |
| Phone: | 828-884-2770 | Cell/Mobile: | -- |
Distribution System
| Line Type |
Size Range (Inches) |
Estimated % of lines |
| Asbestos Cement |
6 |
0.40 % |
| Cast Iron |
4-8 |
17.00 % |
| Ductile Iron |
4-18 |
76.00 % |
| Galvanized Iron |
2 |
1.00 % |
| Polyvinyl Chloride |
2 |
5.60 % |
Programs
The leak detection program consist of following: Investigation and verification of customer initiated notification of leaks. This also includes notification from other municipal divisions that routinely operate within the city's distribution area such as sanitation route employees, meter readers, and Police Dept. personnel. Geophones and high sensitivity audio receivers are used to detect the existence and location of leaks. Use of SCADA to verify and confirm daily tank levels. Rate of flow from water plant is also used a a leak indicator. Thermal imaging from a drone has been used to look for possible leaks also. Water Conservation
There is an emergency interconnect been installed between the Town of Rosman and Brevard, although Rosman does not have the capacity to provide Brevard water. Brevard could provide Rosman water if they where low, but cannot fill Rosman's water storage tank. 2. Water Use Information
Service Area
| Sub-Basin(s) | % of Service Population |
|---|
| French Broad River (05-2) | 100 % |
|
| County(s) | % of Service Population |
|---|
| Transylvania | 100 % |
|
Water Use by Type
| Type of Use |
Metered
Connections |
Metered
Average Use (MGD) |
Non-Metered
Connections |
Non-Metered
Estimated Use (MGD) |
| Residential |
3,861 |
0.3516 |
0 |
0.0000 |
| Commercial |
621 |
0.2931 |
0 |
0.0000 |
| Industrial |
2 |
0.0620 |
0 |
0.0000 |
| Institutional |
113 |
0.1205 |
0 |
0.0000 |
How much water was used for system processes (backwash, line cleaning, flushing, etc.)? 0.0730 MGD
Water Sales
| Purchaser |
PWSID |
Average
Daily Sold
(MGD) |
Days
Used |
Contract |
Required to
comply with water
use restrictions? |
Pipe Size(s)
(Inches) |
Use
Type |
| MGD |
Expiration |
Recurring |
| Town of Rosman |
01-88-115 |
0.0000 |
0 |
|
|
Yes |
No |
|
Emergency |
In 2025 Brevard and Rosman installed an Emergency Interconnect. Rosman does not have the capacity to supply water to Brevard. Brevard can only provide water to Rosman if their system was low. Brevard cannot fill Rosman's water storage tank. This interconnect has never been used yet and no water has been exchanged between the 2 systems so there has been no sales of water. 3. Water Supply Sources
Monthly Withdrawals & Purchases
|
Average Daily
Use (MGD) |
Max Day
Use (MGD) |
|
Average Daily
Use (MGD) |
Max Day
Use (MGD) |
|
Average Daily
Use (MGD) |
Max Day
Use (MGD) |
| Jan |
1.6210 |
1.8650 |
May |
1.6830 |
2.0180 |
Sep |
1.3440 |
1.4420 |
| Feb |
1.5990 |
1.8850 |
Jun |
1.7350 |
2.0550 |
Oct |
1.3460 |
1.5530 |
| Mar |
1.6550 |
1.9330 |
Jul |
1.8250 |
2.1200 |
Nov |
1.3480 |
1.5260 |
| Apr |
1.6690 |
1.9250 |
Aug |
1.6290 |
2.0010 |
Dec |
1.3250 |
1.6010 |

Surface Water Sources
| Stream |
Reservoir |
Average Daily Withdrawal |
Maximum Day
Withdrawal (MGD) |
Available Raw
Water Supply |
Usable On-Stream
Raw Water Supply
Storage (MG) |
| MGD |
Days Used |
MGD |
* Qualifier |
| Catheys Creek |
none |
1.5650 |
365 |
2.1200 |
2.6000 |
SY20 |
0.0000 |
* Qualifier: C=Contract Amount, SY20=20-year Safe Yield, SY50=50-year Safe Yield, F=20% of 7Q10 or other instream flow requirement, CUA=Capacity Use Area Permit
Surface Water Sources (continued)
| Stream |
Reservoir |
Drainage Area
(sq mi) |
Metered? |
Sub-Basin |
County |
Year
Offline |
Use
Type |
| Catheys Creek |
none |
12 |
Yes |
French Broad River (05-2) |
Transylvania |
|
Regular |
Water Treatment Plants
| Plant Name |
Permitted Capacity
(MGD) |
Is Raw Water Metered? |
Is Finished Water Ouput Metered? |
Source |
| Brevard Water Plant |
2.6000 |
Yes |
Yes |
Catheys Creek |
4. Wastewater Information
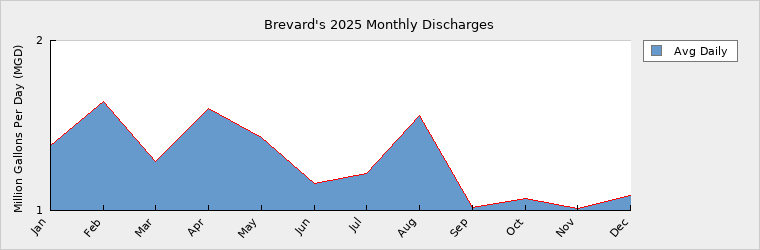
Monthly Discharges
|
Average Daily
Discharge (MGD) |
|
Average Daily
Discharge (MGD) |
|
Average Daily
Discharge (MGD) |
| Jan |
1.3800 |
May |
1.4300 |
Sep |
1.0200 |
| Feb |
1.6400 |
Jun |
1.1600 |
Oct |
1.0700 |
| Mar |
1.2900 |
Jul |
1.2200 |
Nov |
1.0100 |
| Apr |
1.6000 |
Aug |
1.5600 |
Dec |
1.0900 |
The city is working on acquiring funding for a plant expansion now. Engineers have been working on design. Wastewater Permits
| Permit Number |
Type |
Permitted Capacity
(MGD) |
Design Capacity
(MGD) |
Average Annual
Daily Discharge
(MGD) |
Maximum Day Discharge
(MGD) |
Receiving Stream |
Receiving Basin |
| NC0044784 |
WTP |
0.0000 |
0.2750 |
0.0690 |
0.3830 |
Catheys Creek |
French Broad River (05-2) |
| NC0060534 |
WWTP |
2.5000 |
2.5000 |
1.2200 |
4.0750 |
French Broad River |
French Broad River (05-2) |
5. Planning
Projections
| |
2025 |
2030 |
2040 |
2050 |
2060 |
2070 |
| Year-Round Population |
11,336 |
12,250 |
13,500 |
14,750 |
16,000 |
17,500 |
| Seasonal Population |
0 |
2,000 |
2,500 |
3,000 |
3,500 |
4,000 |
| |
| Residential |
0.3516 |
0.3712 |
0.4083 |
0.4491 |
0.4940 |
0.5434 |
| Commercial |
0.2931 |
0.3000 |
0.3100 |
0.3200 |
0.3300 |
0.3400 |
| Industrial |
0.0620 |
0.0626 |
0.0688 |
0.0757 |
0.0765 |
0.0841 |
| Institutional |
0.1205 |
0.1293 |
0.1426 |
0.1568 |
0.1725 |
0.1898 |
| System Process |
0.0730 |
0.0764 |
0.0798 |
0.0836 |
0.0880 |
0.0928 |
| Unaccounted-for |
0.6648 |
0.6938 |
0.7455 |
0.8014 |
0.8574 |
0.9232 |
Demand v/s Percent of Supply
| |
2025 |
2030 |
2040 |
2050 |
2060 |
2070 |
| Surface Water Supply |
2.6000 |
2.6000 |
2.6000 |
2.6000 |
2.6000 |
2.6000 |
| Ground Water Supply |
0.0000 |
0.0000 |
0.0000 |
0.0000 |
0.0000 |
0.0000 |
| Purchases |
0.0000 |
0.0000 |
0.0000 |
0.0000 |
0.0000 |
0.0000 |
| Future Supplies |
0.0000 |
0.0000 |
0.0000 |
0.0000 |
0.0000 |
| Total Available Supply (MGD) |
2.6000 |
2.6000 |
2.6000 |
2.6000 |
2.6000 |
2.6000 |
| Service Area Demand |
1.5650 |
1.6333 |
1.7550 |
1.8866 |
2.0184 |
2.1733 |
| Sales |
0.0000 |
0.0000 |
0.0000 |
0.0000 |
0.0000 |
0.0000 |
| Future Sales |
0.0000 |
0.0000 |
0.0000 |
0.0000 |
0.0000 |
| Total Demand (MGD) |
1.5650 |
1.6333 |
1.7550 |
1.8866 |
2.0184 |
2.1733 |
| Demand as Percent of Supply |
60% |
63% |
68% |
73% |
78% |
84% |

The purpose of the above chart is to show a general indication of how the long-term per capita water demand changes over time. The per capita water demand may actually be different than indicated due to seasonal populations and the accuracy of data submitted. Water systems that have calculated long-term per capita water demand based on a methodology that produces different results may submit their information in the notes field.
Your long-term water demand is 31 gallons per capita per day. What demand management practices do you plan to implement to reduce the per capita water demand (i.e. conduct regular water audits, implement a plumbing retrofit program, employ practices such as rainwater harvesting or reclaimed water)? If these practices are covered elsewhere in your plan, indicate where the practices are discussed here.
Are there other demand management practices you will implement to reduce your future supply needs?
What supplies other than the ones listed in future supplies are being considered to meet your future supply needs?
How does the water system intend to implement the demand management and supply planning components above?
Additional Information
Has this system participated in regional water supply or water use planning? No
What major water supply reports or studies were used for planning?
Please describe any other needs or issues regarding your water supply sources, any water system deficiencies or needed improvements (storage, treatment, etc.) or your ability to meet present and future water needs. Include both quantity and quality considerations, as well as financial, technical, managerial, permitting, and compliance issues:
The Division of Water Resources (DWR) provides the data contained within this
Local Water Supply Plan (LWSP) as a courtesy and service to our customers.
DWR staff does not field verify data. Neither DWR, nor any other party
involved in the preparation of this LWSP attests that the data is completely
free of errors and omissions. Furthermore, data users are cautioned that
LWSPs labeled PROVISIONAL have yet to be reviewed by DWR staff. Subsequent
review may result in significant revision. Questions regarding the accuracy
or limitations of usage of this data should be directed to the water system
and/or DWR.
|