|
The Division of Water Resources (DWR) provides the data contained within this
Local Water Supply Plan (LWSP) as a courtesy and service to our customers.
DWR staff does not field verify data. Neither DWR, nor any other party
involved in the preparation of this LWSP attests that the data is completely
free of errors and omissions. Furthermore, data users are cautioned that
LWSPs labeled PROVISIONAL have yet to be reviewed by DWR staff. Subsequent
review may result in significant revision. Questions regarding the accuracy
or limitations of usage of this data should be directed to the water system
and/or DWR.
1. System Information
Contact Information
Complete
| Water System Name: |
Marshville |
|
PWSID: |
01-90-015 |
| Mailing Address: | 118 E. Union St.
Marshville, NC 28103 | Ownership: | Municipality |
| |
| Contact Person: | Bivens Steele | Title: | Water / Sewer ORC |
| Phone: | 704-624-2515 | Cell/Mobile: | 704-695-5274 |
Distribution System
| Line Type |
Size Range (Inches) |
Estimated % of lines |
| Asbestos Cement |
6 |
2.00 % |
| Cast Iron |
6,8 |
21.00 % |
| Ductile Iron |
6 |
10.00 % |
| Galvanized Iron |
2 |
5.00 % |
| Polyvinyl Chloride |
6,8 |
62.00 % |
Programs
Public Works has installed radio read meters which are able to send alerts if excessive usage is occurring at the service address. Public Works also reads the main water meter daily to compare daily water usage to determine if we have any leaks. Water Conservation
Marshville has an emergency 6-inch connection with the Town of Wingate. Marshville did not use this connection in 2025. 2. Water Use Information
Service Area
| Sub-Basin(s) | % of Service Population |
|---|
| Rocky River (18-4) | 100 % |
|
| County(s) | % of Service Population |
|---|
| Union | 100 % |
|
Water Use by Type
| Type of Use |
Metered
Connections |
Metered
Average Use (MGD) |
Non-Metered
Connections |
Non-Metered
Estimated Use (MGD) |
| Residential |
1,245 |
0.2560 |
0 |
0.0000 |
| Commercial |
34 |
0.0062 |
0 |
0.0000 |
| Industrial |
1 |
0.0031 |
0 |
0.0000 |
| Institutional |
1 |
0.0030 |
0 |
0.0000 |
How much water was used for system processes (backwash, line cleaning, flushing, etc.)? 0.0020 MGD
Water Sales
| Purchaser |
PWSID |
Average
Daily Sold
(MGD) |
Days
Used |
Contract |
Required to
comply with water
use restrictions? |
Pipe Size(s)
(Inches) |
Use
Type |
| MGD |
Expiration |
Recurring |
| Town of Wingate |
01-90-030 |
0.0000 |
0 |
0.0000 |
|
Yes |
No |
6 |
Emergency |
3. Water Supply Sources
Monthly Withdrawals & Purchases
|
Average Daily
Use (MGD) |
Max Day
Use (MGD) |
|
Average Daily
Use (MGD) |
Max Day
Use (MGD) |
|
Average Daily
Use (MGD) |
Max Day
Use (MGD) |
| Jan |
0.2820 |
|
May |
0.2985 |
|
Sep |
0.2744 |
|
| Feb |
0.2875 |
|
Jun |
0.3397 |
|
Oct |
0.2823 |
|
| Mar |
0.2706 |
|
Jul |
0.3417 |
|
Nov |
0.2767 |
|
| Apr |
0.3126 |
|
Aug |
0.4410 |
|
Dec |
0.2670 |
|

Water Purchases From Other Systems
| Seller |
PWSID |
Average
Daily Purchased
(MGD) |
Days
Used |
Contract |
Required to
comply with water
use restrictions? |
Pipe Size(s)
(Inches) |
Use
Type |
| MGD |
Expiration |
Recurring |
| Anson County |
03-04-010 |
0.3062 |
365 |
2.0000 |
2041 |
Yes |
Yes |
8 |
Regular |
| Wingate |
01-90-030 |
0.0000 |
0 |
0.0000 |
|
Yes |
Yes |
6 |
Emergency |
4. Wastewater Information
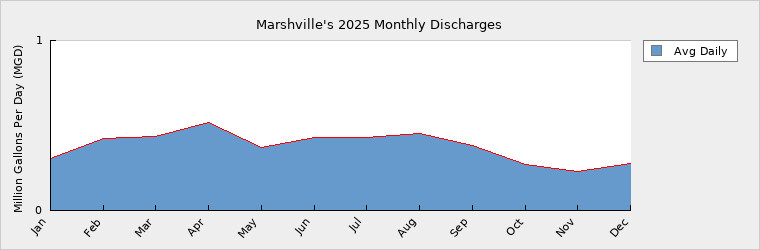
Monthly Discharges
|
Average Daily
Discharge (MGD) |
|
Average Daily
Discharge (MGD) |
|
Average Daily
Discharge (MGD) |
| Jan |
0.3067 |
May |
0.3688 |
Sep |
0.3809 |
| Feb |
0.4241 |
Jun |
0.4294 |
Oct |
0.2690 |
| Mar |
0.4331 |
Jul |
0.4287 |
Nov |
0.2292 |
| Apr |
0.5160 |
Aug |
0.4502 |
Dec |
0.2785 |
Marshville is in the construction phases of building new pump stations to increase wastewater capacities to Anson County. Wastewater Permits
| Permit Number |
Type |
Permitted Capacity
(MGD) |
Design Capacity
(MGD) |
Average Annual
Daily Discharge
(MGD) |
Maximum Day Discharge
(MGD) |
Receiving Stream |
Receiving Basin |
| WQCS00344 |
CS |
0.6900 |
0.6900 |
0.0000 |
|
PeeDee Yadkin River |
Rocky River (18-4) |
Wastewater discharge is accounted for in the wastewater interconnections section. Wastewater Interconnections
| Water System |
PWSID |
Type |
Average Daily Amount |
Contract
Maximum (MGD) |
| MGD |
Days Used |
| Anson County |
03-04-010 |
Discharging |
0.1786 |
365 |
1.0000 |
| Union County |
01-90-413 |
Discharging |
0.2019 |
365 |
0.4000 |
5. Planning
Projections
| |
2025 |
2030 |
2040 |
2050 |
2060 |
2070 |
| Year-Round Population |
2,500 |
2,750 |
3,025 |
3,327 |
3,660 |
4,026 |
| Seasonal Population |
0 |
0 |
0 |
0 |
0 |
0 |
| |
| Residential |
0.2560 |
0.2472 |
0.2723 |
0.2993 |
0.3289 |
0.3615 |
| Commercial |
0.0062 |
0.0200 |
0.0202 |
0.0204 |
0.0206 |
0.0208 |
| Industrial |
0.0031 |
0.0030 |
0.0030 |
0.0031 |
0.0031 |
0.0031 |
| Institutional |
0.0030 |
0.0030 |
0.0030 |
0.0031 |
0.0031 |
0.0031 |
| System Process |
0.0020 |
0.0020 |
0.0020 |
0.0020 |
0.0020 |
0.0020 |
| Unaccounted-for |
0.0359 |
0.0448 |
0.0486 |
0.0534 |
0.0582 |
0.0636 |
Projected residential demand was adjusted to produce a consumption rate of 90 GPCD which is the historical average.
Projected unaccounted-for demand was adjusted to 14% of total demand which is the historical average. Demand v/s Percent of Supply
| |
2025 |
2030 |
2040 |
2050 |
2060 |
2070 |
| Surface Water Supply |
0.0000 |
0.0000 |
0.0000 |
0.0000 |
0.0000 |
0.0000 |
| Ground Water Supply |
0.0000 |
0.0000 |
0.0000 |
0.0000 |
0.0000 |
0.0000 |
| Purchases |
2.0000 |
2.0000 |
2.0000 |
2.0000 |
2.0000 |
2.0000 |
| Future Supplies |
0.0000 |
0.0000 |
0.0000 |
0.0000 |
0.0000 |
| Total Available Supply (MGD) |
2.0000 |
2.0000 |
2.0000 |
2.0000 |
2.0000 |
2.0000 |
| Service Area Demand |
0.3062 |
0.3200 |
0.3491 |
0.3813 |
0.4159 |
0.4541 |
| Sales |
0.0000 |
0.0000 |
0.0000 |
0.0000 |
0.0000 |
0.0000 |
| Future Sales |
0.0000 |
0.0000 |
0.0000 |
0.0000 |
0.0000 |
| Total Demand (MGD) |
0.3062 |
0.3200 |
0.3491 |
0.3813 |
0.4159 |
0.4541 |
| Demand as Percent of Supply |
15% |
16% |
17% |
19% |
21% |
23% |

The purpose of the above chart is to show a general indication of how the long-term per capita water demand changes over time. The per capita water demand may actually be different than indicated due to seasonal populations and the accuracy of data submitted. Water systems that have calculated long-term per capita water demand based on a methodology that produces different results may submit their information in the notes field.
Your long-term water demand is 102 gallons per capita per day. What demand management practices do you plan to implement to reduce the per capita water demand (i.e. conduct regular water audits, implement a plumbing retrofit program, employ practices such as rainwater harvesting or reclaimed water)? If these practices are covered elsewhere in your plan, indicate where the practices are discussed here.
Are there other demand management practices you will implement to reduce your future supply needs?
What supplies other than the ones listed in future supplies are being considered to meet your future supply needs?
How does the water system intend to implement the demand management and supply planning components above?
Additional Information
Has this system participated in regional water supply or water use planning? No
What major water supply reports or studies were used for planning?
Please describe any other needs or issues regarding your water supply sources, any water system deficiencies or needed improvements (storage, treatment, etc.) or your ability to meet present and future water needs. Include both quantity and quality considerations, as well as financial, technical, managerial, permitting, and compliance issues: Marshville Public Works will continue to make water line repairs as quickly as possible to prevent water loss.
The Division of Water Resources (DWR) provides the data contained within this
Local Water Supply Plan (LWSP) as a courtesy and service to our customers.
DWR staff does not field verify data. Neither DWR, nor any other party
involved in the preparation of this LWSP attests that the data is completely
free of errors and omissions. Furthermore, data users are cautioned that
LWSPs labeled PROVISIONAL have yet to be reviewed by DWR staff. Subsequent
review may result in significant revision. Questions regarding the accuracy
or limitations of usage of this data should be directed to the water system
and/or DWR.
|