|
The Division of Water Resources (DWR) provides the data contained within this
Local Water Supply Plan (LWSP) as a courtesy and service to our customers.
DWR staff does not field verify data. Neither DWR, nor any other party
involved in the preparation of this LWSP attests that the data is completely
free of errors and omissions. Furthermore, data users are cautioned that
LWSPs labeled PROVISIONAL have yet to be reviewed by DWR staff. Subsequent
review may result in significant revision. Questions regarding the accuracy
or limitations of usage of this data should be directed to the water system
and/or DWR.
1. System Information
Contact Information
Complete
| Water System Name: |
Denton |
|
PWSID: |
02-29-030 |
| Mailing Address: | P.O. Box 306
Denton, NC 27239 | Ownership: | Municipality |
| |
| Contact Person: | Troy Branch | Title: | Distribution System ORC |
| Phone: | 336-859-4460 | Cell/Mobile: | 336-250-0248 |
Distribution System
| Line Type |
Size Range (Inches) |
Estimated % of lines |
| Asbestos Cement |
6-12 |
30.00 % |
| Ductile Iron |
6-16 |
40.00 % |
| Galvanized Iron |
3/4-2 |
10.00 % |
| Polyvinyl Chloride |
2-8 |
20.00 % |
Programs
Water Conservation
2. Water Use Information
Service Area
| Sub-Basin(s) | % of Service Population |
|---|
| Yadkin River (18-1) | 100 % |
|
| County(s) | % of Service Population |
|---|
| Davidson | 100 % |
|
The current population used was taken from the ACS 2024 5-year report from Censusreporter.org and used the estimated annual growth from that report which is 1.37%. In years past we were estimating by water connections. It was purely an estimate. we feel this number better represents the closest population this year. Water Use by Type
| Type of Use |
Metered
Connections |
Metered
Average Use (MGD) |
Non-Metered
Connections |
Non-Metered
Estimated Use (MGD) |
| Residential |
964 |
0.0931 |
0 |
0.0000 |
| Commercial |
126 |
0.0520 |
0 |
0.0000 |
| Industrial |
4 |
0.0173 |
0 |
0.0000 |
| Institutional |
4 |
0.0100 |
1 |
0.0002 |
How much water was used for system processes (backwash, line cleaning, flushing, etc.)? 0.3763 MGD
Water Sales
| Purchaser |
PWSID |
Average
Daily Sold
(MGD) |
Days
Used |
Contract |
Required to
comply with water
use restrictions? |
Pipe Size(s)
(Inches) |
Use
Type |
| MGD |
Expiration |
Recurring |
| Handy Sanitary District |
02-29-035 |
0.9910 |
365 |
1.1250 |
2034 |
Yes |
No |
6 & 8 |
Regular |
3. Water Supply Sources
Monthly Withdrawals & Purchases
|
Average Daily
Use (MGD) |
Max Day
Use (MGD) |
|
Average Daily
Use (MGD) |
Max Day
Use (MGD) |
|
Average Daily
Use (MGD) |
Max Day
Use (MGD) |
| Jan |
1.6200 |
1.8900 |
May |
1.2000 |
1.4300 |
Sep |
1.8300 |
2.3500 |
| Feb |
1.5700 |
2.1500 |
Jun |
1.3100 |
2.1900 |
Oct |
1.8200 |
2.1700 |
| Mar |
1.4800 |
1.8800 |
Jul |
1.6200 |
1.9500 |
Nov |
1.9000 |
2.3300 |
| Apr |
1.5800 |
2.1750 |
Aug |
1.8600 |
2.3200 |
Dec |
1.9900 |
2.3800 |

Surface Water Sources
| Stream |
Reservoir |
Average Daily Withdrawal |
Maximum Day
Withdrawal (MGD) |
Available Raw
Water Supply |
Usable On-Stream
Raw Water Supply
Storage (MG) |
| MGD |
Days Used |
MGD |
* Qualifier |
| Yadkin River |
Tuckertown Reservoir |
1.6480 |
365 |
2.3800 |
2.3000 |
C |
0.0000 |
* Qualifier: C=Contract Amount, SY20=20-year Safe Yield, SY50=50-year Safe Yield, F=20% of 7Q10 or other instream flow requirement, CUA=Capacity Use Area Permit
Surface Water Sources (continued)
| Stream |
Reservoir |
Drainage Area
(sq mi) |
Metered? |
Sub-Basin |
County |
Year
Offline |
Use
Type |
| Yadkin River |
Tuckertown Reservoir |
3,985 |
Yes |
Yadkin River (18-1) |
Davidson |
|
Regular |
Water Purchases From Other Systems
| Seller |
PWSID |
Average
Daily Purchased
(MGD) |
Days
Used |
Contract |
Required to
comply with water
use restrictions? |
Pipe Size(s)
(Inches) |
Use
Type |
| MGD |
Expiration |
Recurring |
| Handy Sanitary District |
02-29-035 |
0.0000 |
0 |
0.0000 |
|
No |
No |
6 & 8 |
Emergency |
Water Treatment Plants
| Plant Name |
Permitted Capacity
(MGD) |
Is Raw Water Metered? |
Is Finished Water Ouput Metered? |
Source |
| Denton Water Plant |
2.3000 |
Yes |
Yes |
Tuckertown Reservoir |
4. Wastewater Information
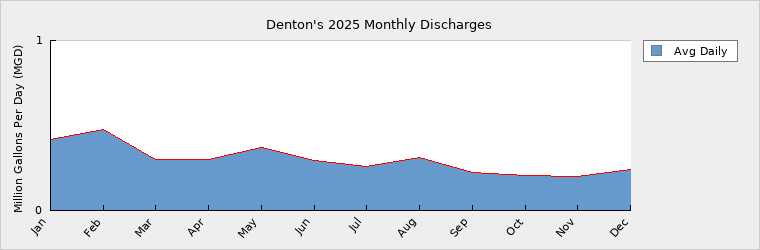
Monthly Discharges
|
Average Daily
Discharge (MGD) |
|
Average Daily
Discharge (MGD) |
|
Average Daily
Discharge (MGD) |
| Jan |
0.4170 |
May |
0.3722 |
Sep |
0.2222 |
| Feb |
0.4774 |
Jun |
0.2959 |
Oct |
0.2039 |
| Mar |
0.3017 |
Jul |
0.2611 |
Nov |
0.2021 |
| Apr |
0.2997 |
Aug |
0.3130 |
Dec |
0.2410 |
Wastewater Permits
| Permit Number |
Type |
Permitted Capacity
(MGD) |
Design Capacity
(MGD) |
Average Annual
Daily Discharge
(MGD) |
Maximum Day Discharge
(MGD) |
Receiving Stream |
Receiving Basin |
| NC0026689 |
WWTP |
0.8000 |
0.8000 |
0.3010 |
1.5290 |
Lick Creek |
Yadkin River (18-1) |
Wastewater Interconnections
| Water System |
PWSID |
Type |
Average Daily Amount |
Contract
Maximum (MGD) |
| MGD |
Days Used |
| Handy Sanitary District |
02-29-035 |
Receiving |
0.0000 |
0 |
|
5. Planning
Projections
| |
2025 |
2030 |
2040 |
2050 |
2060 |
2070 |
| Year-Round Population |
1,527 |
1,614 |
1,694 |
1,736 |
1,780 |
1,824 |
| Seasonal Population |
0 |
0 |
0 |
0 |
0 |
0 |
| |
| Residential |
0.0931 |
0.1006 |
0.1056 |
0.1082 |
0.1137 |
0.1165 |
| Commercial |
0.0520 |
0.0560 |
0.0570 |
0.0570 |
0.0570 |
0.0570 |
| Industrial |
0.0173 |
0.0190 |
0.0210 |
0.0230 |
0.0240 |
0.0260 |
| Institutional |
0.0102 |
0.0105 |
0.0131 |
0.0146 |
0.0160 |
0.0176 |
| System Process |
0.3763 |
0.2800 |
0.2800 |
0.2800 |
0.2800 |
0.2800 |
| Unaccounted-for |
0.1081 |
0.0918 |
0.0939 |
0.0951 |
0.0966 |
0.0979 |
We calculated the year-round population at 1.37% growth through 2030 and then dropped to a 0.5% growth through 2040 and then 0.25% annual growth after due to lack of land for growth and city limit constraints.
There was an increase this year in Industrial due to 1 industry changed ownership and production increased, but has since settled out at end of the year.
We believe the estimate for 2024 Institutional is skewed. The numbers for 2025 are accurate as our water use data confirms.
We believe that our System Process estimates will decrease due updating and adding meters throughout the Water Treatment Plant in the coming years. Demand v/s Percent of Supply
| |
2025 |
2030 |
2040 |
2050 |
2060 |
2070 |
| Surface Water Supply |
2.3000 |
2.3000 |
2.3000 |
2.3000 |
2.3000 |
2.3000 |
| Ground Water Supply |
0.0000 |
0.0000 |
0.0000 |
0.0000 |
0.0000 |
0.0000 |
| Purchases |
0.0000 |
0.0000 |
0.0000 |
0.0000 |
0.0000 |
0.0000 |
| Future Supplies |
0.0000 |
0.0000 |
0.0000 |
0.0000 |
0.0000 |
| Total Available Supply (MGD) |
2.3000 |
2.3000 |
2.3000 |
2.3000 |
2.3000 |
2.3000 |
| Service Area Demand |
0.6570 |
0.5579 |
0.5706 |
0.5779 |
0.5873 |
0.5950 |
| Sales |
0.9910 |
1.1250 |
1.1250 |
1.1250 |
1.1250 |
1.1250 |
| Future Sales |
0.0000 |
0.0000 |
0.0000 |
0.0000 |
0.0000 |
| Total Demand (MGD) |
1.6480 |
1.6829 |
1.6956 |
1.7029 |
1.7123 |
1.7200 |
| Demand as Percent of Supply |
72% |
73% |
74% |
74% |
74% |
75% |

The purpose of the above chart is to show a general indication of how the long-term per capita water demand changes over time. The per capita water demand may actually be different than indicated due to seasonal populations and the accuracy of data submitted. Water systems that have calculated long-term per capita water demand based on a methodology that produces different results may submit their information in the notes field.
Your long-term water demand is 61 gallons per capita per day. What demand management practices do you plan to implement to reduce the per capita water demand (i.e. conduct regular water audits, implement a plumbing retrofit program, employ practices such as rainwater harvesting or reclaimed water)? If these practices are covered elsewhere in your plan, indicate where the practices are discussed here.
1. Conduct regular water audits.
2.The new AMI water meters have already improved our leak detection and response time to leaks as can be seen in our water loss/ unaccounted for water loss.
3. Provide education to residents in the form of quarterly newsletters, CCR, the Town's Facebook page as well as the Town's website.
Are there other demand management practices you will implement to reduce your future supply needs? Rate Studies and efficiency audits at WTP
What supplies other than the ones listed in future supplies are being considered to meet your future supply needs? We are exploring a dedicated interconnection with neighboring water system to be used as an emergency but would be available if future demand required it.
How does the water system intend to implement the demand management and supply planning components above? Using our newly acquired engineers to seek and apply for available grants and continue to increase funds through Capital Improvement Plan.
Additional Information
Has this system participated in regional water supply or water use planning? No
What major water supply reports or studies were used for planning? Utility Pre-billing reports, water meter readings, WTP eMOR Reports and WWTP eDMR Reports
Please describe any other needs or issues regarding your water supply sources, any water system deficiencies or needed improvements (storage, treatment, etc.) or your ability to meet present and future water needs. Include both quantity and quality considerations, as well as financial, technical, managerial, permitting, and compliance issues: We have begun water distribution and collection system mapping to show changes, expansions and improvements. Our engineering firm has been conducting water pressure studies. We are continuing to replace lead gooseneck as per the Lead Line Replacement program.
The Division of Water Resources (DWR) provides the data contained within this
Local Water Supply Plan (LWSP) as a courtesy and service to our customers.
DWR staff does not field verify data. Neither DWR, nor any other party
involved in the preparation of this LWSP attests that the data is completely
free of errors and omissions. Furthermore, data users are cautioned that
LWSPs labeled PROVISIONAL have yet to be reviewed by DWR staff. Subsequent
review may result in significant revision. Questions regarding the accuracy
or limitations of usage of this data should be directed to the water system
and/or DWR.
|