|
The Division of Water Resources (DWR) provides the data contained within this
Local Water Supply Plan (LWSP) as a courtesy and service to our customers.
DWR staff does not field verify data. Neither DWR, nor any other party
involved in the preparation of this LWSP attests that the data is completely
free of errors and omissions. Furthermore, data users are cautioned that
LWSPs labeled PROVISIONAL have yet to be reviewed by DWR staff. Subsequent
review may result in significant revision. Questions regarding the accuracy
or limitations of usage of this data should be directed to the water system
and/or DWR.
1. System Information
Contact Information
Complete
| Water System Name: |
Dobson, Town of |
|
PWSID: |
02-86-030 |
| Mailing Address: | P.O. Box 351
Dobson, NC 27017 | Ownership: | Municipality |
| |
| Contact Person: | Michael Frazier | Title: | Public Works Director |
| Phone: | 336-356-8962 | Cell/Mobile: | 336-712-6418 |
| |
| Secondary Contact: | John Malone (NCRWA) | | Phone: | 336-780-0786 |
| Mailing Address: |
, NC | Cell/Mobile: | 336-712-6418 |
Distribution System
| Line Type |
Size Range (Inches) |
Estimated % of lines |
| Asbestos Cement |
6-12 |
20.00 % |
| Cast Iron |
6 |
40.00 % |
| Ductile Iron |
8-12 |
2.50 % |
| Polyvinyl Chloride |
2-12 |
37.50 % |
Meters are replaced as needed. 540 feet of 2" PVC water main was replaced with new 2" PVC water main. Programs
Town looks for leaks daily visually when working in the system. The Town has a leak detector to be used as needed. Water Conservation
Dobson has a normal use purchase contract with the City of Mount Airy which can provide water needed during an emergency. 2. Water Use Information
Service Area
| Sub-Basin(s) | % of Service Population |
|---|
| Yadkin River (18-1) | 100 % |
|
| County(s) | % of Service Population |
|---|
| Surry | 100 % |
|
Water Use by Type
| Type of Use |
Metered
Connections |
Metered
Average Use (MGD) |
Non-Metered
Connections |
Non-Metered
Estimated Use (MGD) |
| Residential |
853 |
0.0969 |
0 |
0.0000 |
| Commercial |
174 |
0.1179 |
3 |
0.0074 |
| Industrial |
2 |
0.6691 |
0 |
0.0000 |
| Institutional |
43 |
0.0343 |
0 |
0.0000 |
How much water was used for system processes (backwash, line cleaning, flushing, etc.)? 0.0223 MGD
3. Water Supply Sources
Monthly Withdrawals & Purchases
|
Average Daily
Use (MGD) |
Max Day
Use (MGD) |
|
Average Daily
Use (MGD) |
Max Day
Use (MGD) |
|
Average Daily
Use (MGD) |
Max Day
Use (MGD) |
| Jan |
0.9868 |
|
May |
0.9714 |
|
Sep |
1.1861 |
|
| Feb |
0.9524 |
|
Jun |
1.0358 |
|
Oct |
1.2049 |
|
| Mar |
0.8956 |
|
Jul |
1.1258 |
|
Nov |
1.0371 |
|
| Apr |
0.9785 |
|
Aug |
1.0872 |
|
Dec |
1.1378 |
|

Surface Water Sources
| Stream |
Reservoir |
Average Daily Withdrawal |
Maximum Day
Withdrawal (MGD) |
Available Raw
Water Supply |
Usable On-Stream
Raw Water Supply
Storage (MG) |
| MGD |
Days Used |
MGD |
* Qualifier |
| Fisher River |
Dobson Reservoir |
1.2202 |
250 |
1.4400 |
2.0400 |
F |
0.0000 |
* Qualifier: C=Contract Amount, SY20=20-year Safe Yield, SY50=50-year Safe Yield, F=20% of 7Q10 or other instream flow requirement, CUA=Capacity Use Area Permit
Surface Water Sources (continued)
| Stream |
Reservoir |
Drainage Area
(sq mi) |
Metered? |
Sub-Basin |
County |
Year
Offline |
Use
Type |
| Fisher River |
Dobson Reservoir |
128 |
Yes |
Yadkin River (18-1) |
Surry |
|
Regular |
The Surface Water Treatment Plant operates Monday - Friday. Water is purchased from Mount Airy on weekends and holidays. Water Purchases From Other Systems
| Seller |
PWSID |
Average
Daily Purchased
(MGD) |
Days
Used |
Contract |
Required to
comply with water
use restrictions? |
Pipe Size(s)
(Inches) |
Use
Type |
| MGD |
Expiration |
Recurring |
| City of Mount Airy |
02-86-010 |
0.6820 |
115 |
1.5000 |
2052 |
Yes |
Yes |
12 |
Regular |
Water Treatment Plants
| Plant Name |
Permitted Capacity
(MGD) |
Is Raw Water Metered? |
Is Finished Water Ouput Metered? |
Source |
| Town of Dobson WTP |
1.5000 |
Yes |
Yes |
Fisher River |
4. Wastewater Information
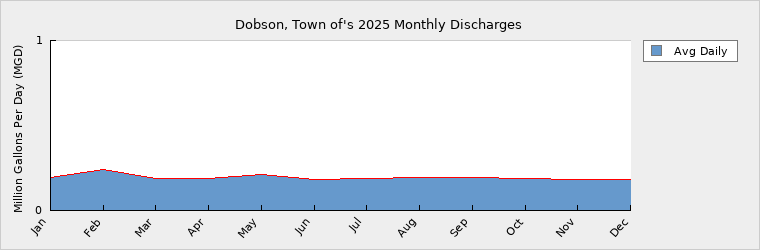
Monthly Discharges
|
Average Daily
Discharge (MGD) |
|
Average Daily
Discharge (MGD) |
|
Average Daily
Discharge (MGD) |
| Jan |
0.1940 |
May |
0.2090 |
Sep |
0.1930 |
| Feb |
0.2420 |
Jun |
0.1840 |
Oct |
0.1890 |
| Mar |
0.1880 |
Jul |
0.1900 |
Nov |
0.1810 |
| Apr |
0.1860 |
Aug |
0.1930 |
Dec |
0.1800 |
Wastewater Permits
| Permit Number |
Type |
Permitted Capacity
(MGD) |
Design Capacity
(MGD) |
Average Annual
Daily Discharge
(MGD) |
Maximum Day Discharge
(MGD) |
Receiving Stream |
Receiving Basin |
| NC0021326 |
WWTP |
0.3500 |
0.3500 |
0.1841 |
0.4680 |
Cody Creek |
Yadkin River (18-1) |
| NC0089265 |
WTP |
0.0150 |
0.0660 |
0.0100 |
0.0240 |
main stem Fisher River |
Yadkin River (18-1) |
5. Planning
Projections
| |
2025 |
2030 |
2040 |
2050 |
2060 |
2070 |
| Year-Round Population |
2,680 |
2,815 |
3,146 |
3,515 |
3,927 |
4,388 |
| Seasonal Population |
0 |
0 |
0 |
0 |
0 |
0 |
| |
| Residential |
0.0969 |
0.1018 |
0.1137 |
0.1270 |
0.1418 |
0.1584 |
| Commercial |
0.1253 |
0.0124 |
0.0138 |
0.0154 |
0.0172 |
0.0193 |
| Industrial |
0.6691 |
0.6691 |
0.6691 |
0.6691 |
0.6691 |
0.6691 |
| Institutional |
0.0343 |
0.0360 |
0.0402 |
0.0449 |
0.0502 |
0.0561 |
| System Process |
0.0223 |
0.0250 |
0.0300 |
0.0350 |
0.0400 |
0.0450 |
| Unaccounted-for |
0.1027 |
0.0915 |
0.0939 |
0.0966 |
0.0995 |
0.1027 |
Population growth of approximately 1.25% annually since 2023 based on increased connections to the system. Previous growth rate was negative 0.78% rate based on 2010 to 2020 census data. Future Supply Sources
| Source Name |
PWSID |
Source Type |
Additional Supply |
Year Online |
Year Offline |
Type |
| City of Mount Airy |
02-86-010 |
Purchase |
0.0000 |
2027 |
|
Regular |
Secondary Source connection has been designed and bid. Bids are higher than expected, additional funding will be required to construct. Construction is expected to be completed by late 2027. No additional contract source water will be negotiated; the connection is for redundancy and to improve system reliability and water quality. Demand v/s Percent of Supply
| |
2025 |
2030 |
2040 |
2050 |
2060 |
2070 |
| Surface Water Supply |
2.0400 |
2.0400 |
2.0400 |
2.0400 |
2.0400 |
2.0400 |
| Ground Water Supply |
0.0000 |
0.0000 |
0.0000 |
0.0000 |
0.0000 |
0.0000 |
| Purchases |
1.5000 |
1.5000 |
1.5000 |
1.5000 |
1.5000 |
1.5000 |
| Future Supplies |
0.0000 |
0.0000 |
0.0000 |
0.0000 |
0.0000 |
| Total Available Supply (MGD) |
3.5400 |
3.5400 |
3.5400 |
3.5400 |
3.5400 |
3.5400 |
| Service Area Demand |
1.0506 |
0.9358 |
0.9607 |
0.9880 |
1.0178 |
1.0506 |
| Sales |
0.0000 |
0.0000 |
0.0000 |
0.0000 |
0.0000 |
0.0000 |
| Future Sales |
0.0000 |
0.0000 |
0.0000 |
0.0000 |
0.0000 |
| Total Demand (MGD) |
1.0506 |
0.9358 |
0.9607 |
0.9880 |
1.0178 |
1.0506 |
| Demand as Percent of Supply |
30% |
26% |
27% |
28% |
29% |
30% |

The purpose of the above chart is to show a general indication of how the long-term per capita water demand changes over time. The per capita water demand may actually be different than indicated due to seasonal populations and the accuracy of data submitted. Water systems that have calculated long-term per capita water demand based on a methodology that produces different results may submit their information in the notes field.
Your long-term water demand is 36 gallons per capita per day. What demand management practices do you plan to implement to reduce the per capita water demand (i.e. conduct regular water audits, implement a plumbing retrofit program, employ practices such as rainwater harvesting or reclaimed water)? If these practices are covered elsewhere in your plan, indicate where the practices are discussed here.
No Changes
Are there other demand management practices you will implement to reduce your future supply needs? None
What supplies other than the ones listed in future supplies are being considered to meet your future supply needs? None
How does the water system intend to implement the demand management and supply planning components above? N/A
Additional Information
Has this system participated in regional water supply or water use planning? No
What major water supply reports or studies were used for planning?
Please describe any other needs or issues regarding your water supply sources, any water system deficiencies or needed improvements (storage, treatment, etc.) or your ability to meet present and future water needs. Include both quantity and quality considerations, as well as financial, technical, managerial, permitting, and compliance issues: Within the next 10 years an additional water tank is needed to provide sufficient storage capacity near Wayne Farms Poultry Plant (Largest User).
The Division of Water Resources (DWR) provides the data contained within this
Local Water Supply Plan (LWSP) as a courtesy and service to our customers.
DWR staff does not field verify data. Neither DWR, nor any other party
involved in the preparation of this LWSP attests that the data is completely
free of errors and omissions. Furthermore, data users are cautioned that
LWSPs labeled PROVISIONAL have yet to be reviewed by DWR staff. Subsequent
review may result in significant revision. Questions regarding the accuracy
or limitations of usage of this data should be directed to the water system
and/or DWR.
|