|
The Division of Water Resources (DWR) provides the data contained within this
Local Water Supply Plan (LWSP) as a courtesy and service to our customers.
DWR staff does not field verify data. Neither DWR, nor any other party
involved in the preparation of this LWSP attests that the data is completely
free of errors and omissions. Furthermore, data users are cautioned that
LWSPs labeled PROVISIONAL have yet to be reviewed by DWR staff. Subsequent
review may result in significant revision. Questions regarding the accuracy
or limitations of usage of this data should be directed to the water system
and/or DWR.
1. System Information
Contact Information
Provisional
| Water System Name: |
Benson |
|
PWSID: |
03-51-025 |
| Mailing Address: | P.O. Box 69
Benson, NC 27504 | Ownership: | Municipality |
| |
| Contact Person: | D. Ray Adams | Title: | Utility Compliance Supervisor/ORC |
| Phone: | 919-894-3553 | Cell/Mobile: | 919-820-1453 |
| |
| Secondary Contact: | Dane D. Rideout | | Phone: | 919-894-3553 |
| Mailing Address: | PO Box 69
Benson, NC 27504 | Cell/Mobile: | 919-820-1453 |
Distribution System
| Line Type |
Size Range (Inches) |
Estimated % of lines |
| Asbestos Cement |
6-16 |
10.60 % |
| Cast Iron |
6-10 |
14.80 % |
| Ductile Iron |
6-16 |
15.30 % |
| Galvanized Iron |
2 |
3.80 % |
| Polyvinyl Chloride |
2-12 |
55.50 % |
In addition to our 0.300 MG tank, we have 0.200 MG per day of storage allocated from the City of Dunn. We are also in the process of adding a 0.750 MG water storage tower to our distribution system. Programs
Our AMI system has the capability to flag potential leaks based on our customer's average daily water use. We utilize NCRWA to conduct leak detection surveys on an annual basis. Public Works staff are instructed to look for water leaks as they travel to complete their daily responsibilities. Water Conservation
In response to our current growth, anticipation of industrial development, and IBT limitations, we are re-visiting the possibility of providing reclaimed water as we have done historically. Additionally, we are planning to better promote our existing water conservation policy with an increased public education campaign. 2. Water Use Information
Service Area
| Sub-Basin(s) | % of Service Population |
|---|
| Cape Fear River (02-3) | 88 % |
| Neuse River (10-1) | 12 % |
|
| County(s) | % of Service Population |
|---|
| Johnston | 100 % |
|
Water Use by Type
| Type of Use |
Metered
Connections |
Metered
Average Use (MGD) |
Non-Metered
Connections |
Non-Metered
Estimated Use (MGD) |
| Residential |
1,826 |
0.2110 |
45 |
0.0000 |
| Commercial |
327 |
0.1260 |
0 |
0.0000 |
| Industrial |
5 |
0.3330 |
0 |
0.0000 |
| Institutional |
12 |
0.0090 |
0 |
0.0000 |
How much water was used for system processes (backwash, line cleaning, flushing, etc.)? 0.0700 MGD
Water Sales
| Purchaser |
PWSID |
Average
Daily Sold
(MGD) |
Days
Used |
Contract |
Required to
comply with water
use restrictions? |
Pipe Size(s)
(Inches) |
Use
Type |
| MGD |
Expiration |
Recurring |
| Johnston County |
03-51-070 |
0.0020 |
365 |
0.0100 |
2026 |
Yes |
Yes |
12 |
Regular |
3. Water Supply Sources
Monthly Withdrawals & Purchases
|
Average Daily
Use (MGD) |
Max Day
Use (MGD) |
|
Average Daily
Use (MGD) |
Max Day
Use (MGD) |
|
Average Daily
Use (MGD) |
Max Day
Use (MGD) |
| Jan |
0.8550 |
0.9540 |
May |
0.8260 |
0.9690 |
Sep |
0.9760 |
1.1940 |
| Feb |
0.8070 |
0.9560 |
Jun |
1.1060 |
1.1290 |
Oct |
0.9610 |
1.0700 |
| Mar |
0.8400 |
0.9960 |
Jul |
1.0730 |
1.2520 |
Nov |
0.8210 |
1.0270 |
| Apr |
0.8840 |
0.9690 |
Aug |
0.9280 |
1.1670 |
Dec |
0.7750 |
0.9600 |

Water Purchases From Other Systems
| Seller |
PWSID |
Average
Daily Purchased
(MGD) |
Days
Used |
Contract |
Required to
comply with water
use restrictions? |
Pipe Size(s)
(Inches) |
Use
Type |
| MGD |
Expiration |
Recurring |
| Dunn |
03-43-010 |
0.7800 |
365 |
1.2000 |
|
Yes |
Yes |
16 |
Regular |
| Johnston County |
03-51-070 |
0.1190 |
365 |
|
|
Yes |
Yes |
12,16 |
Regular |
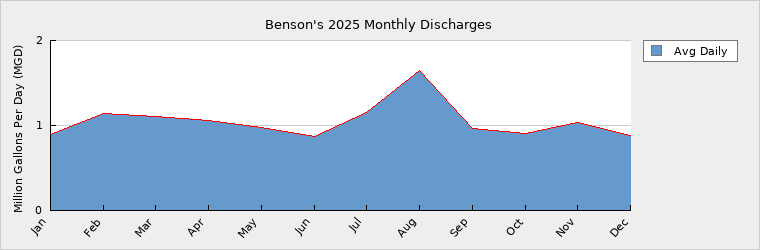
4. Wastewater Information
Monthly Discharges
|
Average Daily
Discharge (MGD) |
|
Average Daily
Discharge (MGD) |
|
Average Daily
Discharge (MGD) |
| Jan |
0.8930 |
May |
0.9750 |
Sep |
0.9660 |
| Feb |
1.1360 |
Jun |
0.8760 |
Oct |
0.9060 |
| Mar |
1.1070 |
Jul |
1.1490 |
Nov |
1.0380 |
| Apr |
1.0580 |
Aug |
1.6430 |
Dec |
0.8780 |
Benson has plans to expand the wastewater treatment facility pending an approved secondary discharge location to be determined by the state. Wastewater Permits
| Permit Number |
Type |
Permitted Capacity
(MGD) |
Design Capacity
(MGD) |
Average Annual
Daily Discharge
(MGD) |
Maximum Day Discharge
(MGD) |
Receiving Stream |
Receiving Basin |
| NC0020389 |
WWTP |
1.9000 |
2.1000 |
1.0500 |
|
Hannah Creek |
Neuse River (10-1) |
Wastewater Interconnections
| Water System |
PWSID |
Type |
Average Daily Amount |
Contract
Maximum (MGD) |
| MGD |
Days Used |
| Johnston County |
03-51-070 |
Receiving |
0.2630 |
365 |
|
The average daily amount of wastewater received from this interconnection in 2025 is also included 5. Planning
Projections
| |
2025 |
2030 |
2040 |
2050 |
2060 |
2070 |
| Year-Round Population |
4,802 |
6,027 |
6,527 |
6,927 |
7,227 |
7,427 |
| Seasonal Population |
0 |
0 |
0 |
0 |
0 |
0 |
| |
| Residential |
0.2110 |
0.3100 |
0.3300 |
0.3500 |
0.3800 |
0.4100 |
| Commercial |
0.1260 |
0.1560 |
0.1850 |
0.2020 |
0.2150 |
0.2300 |
| Industrial |
0.3330 |
1.3330 |
2.6000 |
2.6500 |
2.7000 |
2.7500 |
| Institutional |
0.0090 |
0.0150 |
0.0155 |
0.0160 |
0.0165 |
0.0170 |
| System Process |
0.0700 |
0.0660 |
0.0660 |
0.0600 |
0.0600 |
0.0500 |
| Unaccounted-for |
0.1480 |
0.1000 |
0.0900 |
0.0800 |
0.0700 |
0.0600 |
Res Connections: 25-1871, 26-2021, 27-2121, 28-2206, 29-2286, 30-2361, 40-2861, 50-3261, 60-3561, 70-3761
25+83, 26+150, 27+100, 28+85, 29+80, 30+75, 40+500, 50+400, 60+300, 70+200 Future Supply Sources
| Source Name |
PWSID |
Source Type |
Additional Supply |
Year Online |
Year Offline |
Type |
| City of Dunn |
03-43-010 |
Purchase |
1.2000 |
2030 |
|
Regular |
| City of Dunn |
03-43-010 |
Purchase |
1.7000 |
2040 |
|
Regular |
| City of Dunn |
03-43-010 |
Purchase |
0.2000 |
2050 |
|
Regular |
| City of Dunn |
03-43-010 |
Purchase |
0.2000 |
2060 |
|
Regular |
| City of Dunn |
03-43-010 |
Purchase |
0.2000 |
2070 |
|
Regular |
Demand v/s Percent of Supply
| |
2025 |
2030 |
2040 |
2050 |
2060 |
2070 |
| Surface Water Supply |
0.0000 |
0.0000 |
0.0000 |
0.0000 |
0.0000 |
0.0000 |
| Ground Water Supply |
0.0000 |
0.0000 |
0.0000 |
0.0000 |
0.0000 |
0.0000 |
| Purchases |
1.3190 |
1.3190 |
1.3190 |
1.3190 |
1.3190 |
1.3190 |
| Future Supplies |
1.2000 |
2.9000 |
3.1000 |
3.3000 |
3.5000 |
| Total Available Supply (MGD) |
1.3190 |
2.5190 |
4.2190 |
4.4190 |
4.6190 |
4.8190 |
| Service Area Demand |
0.8970 |
1.9800 |
3.2865 |
3.3580 |
3.4415 |
3.5170 |
| Sales |
0.0020 |
0.0100 |
0.0100 |
0.0100 |
0.0100 |
0.0100 |
| Future Sales |
0.0000 |
0.0000 |
0.0000 |
0.0000 |
0.0000 |
| Total Demand (MGD) |
0.8990 |
1.9900 |
3.2965 |
3.3680 |
3.4515 |
3.5270 |
| Demand as Percent of Supply |
68% |
79% |
78% |
76% |
75% |
73% |

The purpose of the above chart is to show a general indication of how the long-term per capita water demand changes over time. The per capita water demand may actually be different than indicated due to seasonal populations and the accuracy of data submitted. Water systems that have calculated long-term per capita water demand based on a methodology that produces different results may submit their information in the notes field.
Your long-term water demand is 44 gallons per capita per day. What demand management practices do you plan to implement to reduce the per capita water demand (i.e. conduct regular water audits, implement a plumbing retrofit program, employ practices such as rainwater harvesting or reclaimed water)? If these practices are covered elsewhere in your plan, indicate where the practices are discussed here.
As part of our ongoing commitment to sustainable growth and our Board's vision for increased industrial development, we are assessing the feasibility of reactivating the town's reclaimed water system. Additionally, a comprehensive water audit is scheduled to take place this year, with plans for audits to be scheduled on a routine basis moving forward. In compliance with the EPA's revised Lead and Copper Rule, we are actively identifying water service lines with unknown material. Some of the lines discovered so far have consisted of galvanized iron material and were found to be leaking and were subsequently replaced. As additional lines of this nature are identified and replaced, further improvement in our per capita demand is expected.
Are there other demand management practices you will implement to reduce your future supply needs? Benson's "unaccounted for" water loss has risen since the last report. In an effort to reduce water consumption and improve system efficiency, we are currently conducting a leak detection survey which has covered approximately 5% of our system to date. We are also exploring options to reduce our reliance on purchased water by revisiting the possibility of reactivating the town's previous groundwater system. This would serve to function as a supplementary option to help support increased industrial demands as well as providing an additional source of supply during emergencies. In response to both current and projected growth, the town is in the process of adding a new 750,000 gallon water tower to increase storage capacity.
What supplies other than the ones listed in future supplies are being considered to meet your future supply needs? As a purchased water system with limited capacity, we are aware of the importance of securing additional sources to meet future demand. We are also focused on improving the efficiency of our existing water sources to delay the immediate need to obtain additional sources. To aid in this effort, we are updating our water system's hydraulic model to assess various operating options and to better analyze industrial capacity requests.
How does the water system intend to implement the demand management and supply planning components above? The implementation of the demand management and supply planning practices outlined above is well underway. Many of these initiaves are being carried out at minimal cost through the utilization of available grants. As a member of NCRWA, the town has access to valuable technical support, leak detection, water audits, and other related services at no additional cost.
Additional Information
Has this system participated in regional water supply or water use planning? Yes, Both of the town's bulk water suppliers have recently conducted feasibility studies regarding water merger and regionalization
What major water supply reports or studies were used for planning? Bulk water purchase reports, monthly billing reports, previous water supply plans, asset management and capital improvement plans, preliminary engineering reports for new projects, accounted for non-revenue and unaccounted for water loss reports, water purchase contracts, water conservation ordinance, previous hydraulic modeling assessments, booster pump performance data, previous and current regionalization studies, and consideration of the governing Board's vision for increased industrial growth in town.
Please describe any other needs or issues regarding your water supply sources, any water system deficiencies or needed improvements (storage, treatment, etc.) or your ability to meet present and future water needs. Include both quantity and quality considerations, as well as financial, technical, managerial, permitting, and compliance issues: As a result of Benson's continued growth, we have engaged in discussions with both of our bulk water suppliers to ensure sufficient capacity will be available to meet our rising demand. We have identified water system asset upgrades that are necessary to support projected future demands, and are actively pursuing grant funding for those yet to be funded. Assets essential for meeting short-term regulatory requirement's however, have been fully funded and are nearing construction phase.
The Division of Water Resources (DWR) provides the data contained within this
Local Water Supply Plan (LWSP) as a courtesy and service to our customers.
DWR staff does not field verify data. Neither DWR, nor any other party
involved in the preparation of this LWSP attests that the data is completely
free of errors and omissions. Furthermore, data users are cautioned that
LWSPs labeled PROVISIONAL have yet to be reviewed by DWR staff. Subsequent
review may result in significant revision. Questions regarding the accuracy
or limitations of usage of this data should be directed to the water system
and/or DWR.
|