|
The Division of Water Resources (DWR) provides the data contained within this
Local Water Supply Plan (LWSP) as a courtesy and service to our customers.
DWR staff does not field verify data. Neither DWR, nor any other party
involved in the preparation of this LWSP attests that the data is completely
free of errors and omissions. Furthermore, data users are cautioned that
LWSPs labeled PROVISIONAL have yet to be reviewed by DWR staff. Subsequent
review may result in significant revision. Questions regarding the accuracy
or limitations of usage of this data should be directed to the water system
and/or DWR.
1. System Information
Contact Information
Complete
| Water System Name: |
Dare Co Regional |
|
PWSID: |
04-28-030 |
| Mailing Address: | 600 Mustian Street
Kill Devil Hills, NC 27948 | Ownership: | County |
| |
| Contact Person: | Robert Wernock | Title: | Dare County Regional Superintendent |
| Phone: | 252-475-5808 | Cell/Mobile: | -- |
| |
| Secondary Contact: | Jessica King | | Phone: | 252-475-5606 |
| Mailing Address: | 600 Mustian Street
Kill Devil Hills, NC 27948 | Cell/Mobile: | -- |
Distribution System
| Line Type |
Size Range (Inches) |
Estimated % of lines |
| Asbestos Cement |
6-16 |
2.00 % |
| Ductile Iron |
6-30 |
4.00 % |
| Polyvinyl Chloride |
2-24 |
94.00 % |
Programs
Water Conservation
2. Water Use Information
Service Area
| Sub-Basin(s) | % of Service Population |
|---|
| Albemarle Sound (12-1) | 100 % |
|
| County(s) | % of Service Population |
|---|
| Dare | 100 % |
|
https://maps.darecountync.gov/ Water Use by Type
| Type of Use |
Metered
Connections |
Metered
Average Use (MGD) |
Non-Metered
Connections |
Non-Metered
Estimated Use (MGD) |
| Residential |
13,347 |
2.0570 |
0 |
0.0000 |
| Commercial |
513 |
0.3265 |
0 |
0.0000 |
| Industrial |
0 |
0.0000 |
0 |
0.0000 |
| Institutional |
49 |
0.0138 |
0 |
0.0000 |
How much water was used for system processes (backwash, line cleaning, flushing, etc.)? 1.9600 MGD
There was a reevaluation of the population by PWS. During the last inspection the population was discussed, tourism vs year round, a new value for connections was determined. Water Sales
| Purchaser |
PWSID |
Average
Daily Sold
(MGD) |
Days
Used |
Contract |
Required to
comply with water
use restrictions? |
Pipe Size(s)
(Inches) |
Use
Type |
| MGD |
Expiration |
Recurring |
| Kill Devil Hills |
04-28-015 |
1.3020 |
365 |
3.0000 |
2036 |
Yes |
Yes |
12-24 |
Regular |
| Manteo |
04-28-020 |
0.2460 |
365 |
1.0000 |
2027 |
Yes |
Yes |
12 |
Regular |
| Nags Head |
04-28-010 |
1.1320 |
365 |
3.5000 |
2036 |
Yes |
Yes |
12 |
Regular |
The contract with Kill Devil Hills and Nags head are much greater than the current demand. It is written in the contract with both Nags Head and Kill Devil Hills that if the facility has exceeded 90% for two consecutive days and the towns have exceeded their allocations, they must pay to add additional treatment trains. Based on the Kill Devil Hills and Nags head LWSP's, their demand will remain less than half of the contract amount through 2060. 3. Water Supply Sources
Monthly Withdrawals & Purchases
|
Average Daily
Use (MGD) |
Max Day
Use (MGD) |
|
Average Daily
Use (MGD) |
Max Day
Use (MGD) |
|
Average Daily
Use (MGD) |
Max Day
Use (MGD) |
| Jan |
4.4960 |
|
May |
8.8570 |
|
Sep |
8.5580 |
|
| Feb |
5.5600 |
|
Jun |
10.2780 |
|
Oct |
6.5250 |
|
| Mar |
6.2600 |
|
Jul |
10.8430 |
|
Nov |
5.2460 |
|
| Apr |
7.9500 |
|
Aug |
10.4000 |
|
Dec |
4.6130 |
|

Ground Water Sources
| Name or Number |
Average Daily Withdrawal (MGD) |
Max Day Withdrawal (MGD) |
12-Hour Supply
(MGD) |
CUA Reduction |
Year Offline |
Use Type |
| MGD |
Days Used |
| NRO Well 01 |
0.6480 |
146 |
|
0.1580 |
|
|
Regular |
| NRO Well 02 |
0.5400 |
173 |
|
0.3240 |
|
|
Regular |
| NRO Well 03 |
0.5040 |
136 |
|
0.4390 |
|
|
Regular |
| NRO Well 04 |
0.5040 |
156 |
|
0.3960 |
|
|
Regular |
| NRO Well 05 |
0.5760 |
181 |
|
0.4680 |
|
|
Regular |
| NRO Well 06 |
0.5400 |
206 |
|
0.2880 |
|
|
Regular |
| NRO Well 07 |
0.5760 |
255 |
|
0.3600 |
|
|
Regular |
| NRO Well 08 |
0.4320 |
210 |
|
0.4320 |
|
|
Regular |
| NRO Well 09 |
0.4790 |
139 |
|
0.6260 |
|
|
Regular |
| NRO Well 10 |
0.6480 |
117 |
|
0.5900 |
|
|
Regular |
| NRO well 11 |
0.4320 |
163 |
|
0.3600 |
|
|
Regular |
| NRO well 12 |
0.7200 |
201 |
|
0.4390 |
|
|
Regular |
| NRO well 15 |
0.7560 |
291 |
|
0.3960 |
|
|
Regular |
| NRO well 17 |
0.7920 |
183 |
|
0.3420 |
|
|
Regular |
| S-10 |
0.3920 |
236 |
|
0.3430 |
|
|
Regular |
| S-11 |
0.0000 |
0 |
|
0.3500 |
|
2024 |
Regular |
| S-13 |
0.5079 |
254 |
|
0.4070 |
|
|
Regular |
| S-14 |
0.5297 |
264 |
|
0.3890 |
|
|
Regular |
| S-2 |
0.4710 |
321 |
|
0.4400 |
|
|
Regular |
| S-4 |
0.4900 |
321 |
|
0.4010 |
|
|
Regular |
| S-5 |
0.5476 |
316 |
|
0.4420 |
|
|
Regular |
| S-6 |
0.4612 |
210 |
|
0.4190 |
|
|
Regular |
| S-7 |
0.4543 |
229 |
|
0.3590 |
|
|
Regular |
| S-8 |
0.5510 |
251 |
|
0.4430 |
|
|
Regular |
Ground Water Sources (continued)
| Name or Number |
Well Depth (Feet) |
Casing Depth
(Feet) |
Screen Depth (Feet) |
Well Diameter (Inches) |
Pump Intake Depth (Feet) |
Metered? |
| Top |
Bottom |
| NRO Well 01 |
425 |
325 |
325 |
425 |
8 |
90 |
Yes |
| NRO Well 02 |
425 |
325 |
325 |
425 |
8 |
120 |
Yes |
| NRO Well 03 |
425 |
325 |
325 |
425 |
8 |
80 |
Yes |
| NRO Well 04 |
425 |
325 |
325 |
425 |
8 |
80 |
Yes |
| NRO Well 05 |
425 |
325 |
325 |
425 |
8 |
90 |
Yes |
| NRO Well 06 |
425 |
325 |
325 |
425 |
8 |
90 |
Yes |
| NRO Well 07 |
425 |
325 |
325 |
425 |
8 |
80 |
Yes |
| NRO Well 08 |
425 |
325 |
325 |
425 |
8 |
80 |
Yes |
| NRO Well 09 |
410 |
310 |
310 |
410 |
8 |
80 |
Yes |
| NRO Well 10 |
402 |
302 |
302 |
402 |
8 |
120 |
Yes |
| NRO well 11 |
410 |
105 |
295 |
405 |
8 |
100 |
Yes |
| NRO well 12 |
435 |
100 |
310 |
430 |
8 |
100 |
Yes |
| NRO well 15 |
395 |
98 |
290 |
390 |
8 |
140 |
Yes |
| NRO well 17 |
430 |
100 |
315 |
425 |
8 |
160 |
Yes |
| S-10 |
250 |
141 |
141 |
192 |
8 |
140 |
Yes |
| S-11 |
223 |
187 |
187 |
218 |
8 |
120 |
Yes |
| S-13 |
225 |
176 |
176 |
216 |
8 |
80 |
Yes |
| S-14 |
200 |
126 |
150 |
200 |
10 |
126 |
Yes |
| S-2 |
222 |
167 |
167 |
217 |
10 |
100 |
Yes |
| S-4 |
250 |
170 |
170 |
220 |
8 |
100 |
Yes |
| S-5 |
235 |
168 |
168 |
218 |
8 |
140 |
Yes |
| S-6 |
225 |
150 |
150 |
220 |
10 |
100 |
Yes |
| S-7 |
250 |
165 |
165 |
215 |
8 |
100 |
Yes |
| S-8 |
250 |
162 |
162 |
212 |
8 |
100 |
Yes |
Water Purchases From Other Systems
| Seller |
PWSID |
Average
Daily Purchased
(MGD) |
Days
Used |
Contract |
Required to
comply with water
use restrictions? |
Pipe Size(s)
(Inches) |
Use
Type |
| MGD |
Expiration |
Recurring |
| Kill Devil Hills |
04-28-015 |
0.0000 |
0 |
0.0000 |
2036 |
Yes |
Yes |
8 |
Emergency |
| Nags Head |
04-28-010 |
0.0000 |
0 |
0.0000 |
2036 |
Yes |
Yes |
12 |
Emergency |
Water Treatment Plants
| Plant Name |
Permitted Capacity
(MGD) |
Is Raw Water Metered? |
Is Finished Water Ouput Metered? |
Source |
| Dare Co NRO |
6.5000 |
Yes |
Yes |
Groundwater |
| Skyco Water Plant |
6.3000 |
Yes |
Yes |
Groundwater |
Dare County has plans to construct more wells at the Skyco Treatment plant and add additional treatments trains as needed. Both will increase capacity and quality of product. 4. Wastewater Information
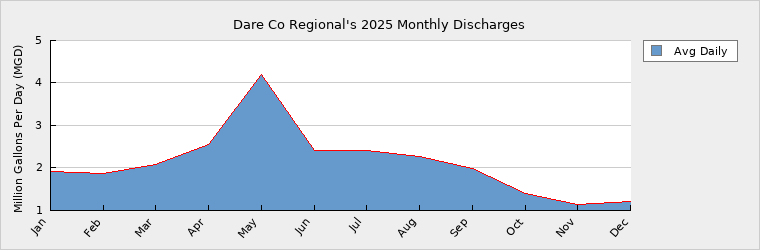
Monthly Discharges
|
Average Daily
Discharge (MGD) |
|
Average Daily
Discharge (MGD) |
|
Average Daily
Discharge (MGD) |
| Jan |
1.9170 |
May |
4.2040 |
Sep |
1.9850 |
| Feb |
1.8630 |
Jun |
2.4100 |
Oct |
1.4040 |
| Mar |
2.0720 |
Jul |
2.4160 |
Nov |
1.1420 |
| Apr |
2.5480 |
Aug |
2.2780 |
Dec |
1.2090 |
Wastewater Permits
| Permit Number |
Type |
Permitted Capacity
(MGD) |
Design Capacity
(MGD) |
Average Annual
Daily Discharge
(MGD) |
Maximum Day Discharge
(MGD) |
Receiving Stream |
Receiving Basin |
| NC0035670 |
WTP |
5.0000 |
0.6180 |
0.5000 |
1.0000 |
Unnamed Tributary |
Albemarle Sound (12-1) |
| NC0070157 |
WTP |
0.0000 |
1.9050 |
1.4000 |
2.9000 |
002 Atlantic |
Albemarle Sound (12-1) |
5. Planning
Projections
| |
2025 |
2030 |
2040 |
2050 |
2060 |
2070 |
| Year-Round Population |
28,732 |
29,900 |
31,000 |
33,000 |
35,000 |
37,000 |
| Seasonal Population |
52,000 |
52,000 |
52,000 |
52,000 |
52,000 |
52,000 |
| |
| Residential |
2.0570 |
2.2000 |
2.3000 |
2.4000 |
2.5000 |
2.6000 |
| Commercial |
0.3265 |
0.3420 |
0.3420 |
0.3420 |
0.3420 |
0.3420 |
| Industrial |
0.0000 |
0.0000 |
0.0000 |
0.0000 |
0.0000 |
0.0000 |
| Institutional |
0.0138 |
0.0120 |
0.0120 |
0.0120 |
0.0120 |
0.0120 |
| System Process |
1.9600 |
1.8000 |
1.8000 |
1.8000 |
1.8000 |
1.8000 |
| Unaccounted-for |
0.3403 |
1.2231 |
1.2512 |
1.2793 |
1.3074 |
1.3355 |
Demand v/s Percent of Supply
| |
2025 |
2030 |
2040 |
2050 |
2060 |
2070 |
| Surface Water Supply |
0.0000 |
0.0000 |
0.0000 |
0.0000 |
0.0000 |
0.0000 |
| Ground Water Supply |
9.6110 |
9.2610 |
9.2610 |
9.2610 |
9.2610 |
9.2610 |
| Purchases |
0.0000 |
0.0000 |
0.0000 |
0.0000 |
0.0000 |
0.0000 |
| Future Supplies |
0.0000 |
0.0000 |
0.0000 |
0.0000 |
0.0000 |
| Total Available Supply (MGD) |
9.6110 |
9.2610 |
9.2610 |
9.2610 |
9.2610 |
9.2610 |
| Service Area Demand |
4.6976 |
5.5771 |
5.7052 |
5.8333 |
5.9614 |
6.0895 |
| Sales |
2.6800 |
7.5000 |
7.5000 |
7.5000 |
7.5000 |
7.5000 |
| Future Sales |
0.0000 |
0.0000 |
0.0000 |
0.0000 |
0.0000 |
| Total Demand (MGD) |
7.3776 |
13.0771 |
13.2052 |
13.3333 |
13.4614 |
13.5895 |
| Demand as Percent of Supply |
77% |
141% |
143% |
144% |
145% |
147% |

The purpose of the above chart is to show a general indication of how the long-term per capita water demand changes over time. The per capita water demand may actually be different than indicated due to seasonal populations and the accuracy of data submitted. Water systems that have calculated long-term per capita water demand based on a methodology that produces different results may submit their information in the notes field.
Your long-term water demand is 72 gallons per capita per day. What demand management practices do you plan to implement to reduce the per capita water demand (i.e. conduct regular water audits, implement a plumbing retrofit program, employ practices such as rainwater harvesting or reclaimed water)? If these practices are covered elsewhere in your plan, indicate where the practices are discussed here.
New automated meters are being added with leak detection and notification. This should help stop leaks much sooner to save water at vacant vacation homes, especially in the offseason but during peak season as well.
Are there other demand management practices you will implement to reduce your future supply needs? New automated meters are being added with leak detection and notification.
What supplies other than the ones listed in future supplies are being considered to meet your future supply needs? Additional wells and two trains for the Skyco plant are being added. Infrastructure is in place to expand with RO trains as well.
How does the water system intend to implement the demand management and supply planning components above? No changes
Additional Information
Has this system participated in regional water supply or water use planning? No
What major water supply reports or studies were used for planning?
Please describe any other needs or issues regarding your water supply sources, any water system deficiencies or needed improvements (storage, treatment, etc.) or your ability to meet present and future water needs. Include both quantity and quality considerations, as well as financial, technical, managerial, permitting, and compliance issues:
The Division of Water Resources (DWR) provides the data contained within this
Local Water Supply Plan (LWSP) as a courtesy and service to our customers.
DWR staff does not field verify data. Neither DWR, nor any other party
involved in the preparation of this LWSP attests that the data is completely
free of errors and omissions. Furthermore, data users are cautioned that
LWSPs labeled PROVISIONAL have yet to be reviewed by DWR staff. Subsequent
review may result in significant revision. Questions regarding the accuracy
or limitations of usage of this data should be directed to the water system
and/or DWR.
|