|
The Division of Water Resources (DWR) provides the data contained within this
Local Water Supply Plan (LWSP) as a courtesy and service to our customers.
DWR staff does not field verify data. Neither DWR, nor any other party
involved in the preparation of this LWSP attests that the data is completely
free of errors and omissions. Furthermore, data users are cautioned that
LWSPs labeled PROVISIONAL have yet to be reviewed by DWR staff. Subsequent
review may result in significant revision. Questions regarding the accuracy
or limitations of usage of this data should be directed to the water system
and/or DWR.
1. System Information
Contact Information
Provisional
| Water System Name: |
Greenevers |
|
PWSID: |
04-31-060 |
| Mailing Address: | 314 E. Charity Road
Greenevers, NC 28458 | Ownership: | Municipality |
| |
| Contact Person: | Emma Brinson | Title: | Admin-Clerk |
| Phone: | 910-289-3078 | Cell/Mobile: | -- |
| |
| Secondary Contact: | Mike Houston | | Phone: | 919-812-6088 |
| Mailing Address: |
, | Cell/Mobile: | -- |
Distribution System
| Line Type |
Size Range (Inches) |
Estimated % of lines |
| Polyvinyl Chloride |
6 |
100.00 % |
All water meters were replaced in 2025 to a new AMI system. Programs
Employees look for leak as they ride throughout the system on a daily basis. We also utilize NCRWA as needed. Water Conservation
2. Water Use Information
Service Area
| Sub-Basin(s) | % of Service Population |
|---|
| Northeast Cape Fear River (02-5) | 100 % |
|
| County(s) | % of Service Population |
|---|
| Duplin | 100 % |
|
Water Use by Type
| Type of Use |
Metered
Connections |
Metered
Average Use (MGD) |
Non-Metered
Connections |
Non-Metered
Estimated Use (MGD) |
| Residential |
439 |
0.0486 |
0 |
0.0000 |
| Commercial |
15 |
0.0016 |
0 |
0.0000 |
| Industrial |
0 |
0.0000 |
0 |
0.0000 |
| Institutional |
0 |
0.0000 |
0 |
0.0000 |
How much water was used for system processes (backwash, line cleaning, flushing, etc.)? 0.0020 MGD
3. Water Supply Sources
Monthly Withdrawals & Purchases
|
Average Daily
Use (MGD) |
Max Day
Use (MGD) |
|
Average Daily
Use (MGD) |
Max Day
Use (MGD) |
|
Average Daily
Use (MGD) |
Max Day
Use (MGD) |
| Jan |
0.1138 |
0.2870 |
May |
0.0734 |
0.1120 |
Sep |
0.0945 |
0.1640 |
| Feb |
0.1097 |
0.1450 |
Jun |
0.0820 |
0.1350 |
Oct |
0.0673 |
0.1030 |
| Mar |
0.0934 |
0.1550 |
Jul |
0.0827 |
0.1590 |
Nov |
0.0710 |
0.1150 |
| Apr |
0.1038 |
0.1690 |
Aug |
0.0915 |
0.1310 |
Dec |
0.1209 |
0.1160 |
We began purchasing water from Duplin County during the month of December 2025, due to our elevated storage tank and well(s) rehabilitation projects. 
Ground Water Sources
| Name or Number |
Average Daily Withdrawal (MGD) |
Max Day Withdrawal (MGD) |
12-Hour Supply
(MGD) |
CUA Reduction |
Year Offline |
Use Type |
| MGD |
Days Used |
| 1 |
0.0702 |
340 |
0.2670 |
0.1800 |
CUA10 |
|
Regular |
| 2 |
0.0192 |
337 |
0.0600 |
0.1800 |
CUA10 |
|
Regular |
Ground Water Sources (continued)
| Name or Number |
Well Depth (Feet) |
Casing Depth
(Feet) |
Screen Depth (Feet) |
Well Diameter (Inches) |
Pump Intake Depth (Feet) |
Metered? |
| Top |
Bottom |
| 1 |
320 |
|
241 |
316 |
8 |
126 |
Yes |
| 2 |
278 |
|
148 |
275 |
8 |
126 |
Yes |
Water Purchases From Other Systems
| Seller |
PWSID |
Average
Daily Purchased
(MGD) |
Days
Used |
Contract |
Required to
comply with water
use restrictions? |
Pipe Size(s)
(Inches) |
Use
Type |
| MGD |
Expiration |
Recurring |
| Duplin County |
04-31-085 |
0.0540 |
28 |
0.0000 |
|
Yes |
No |
6 |
Emergency |
4. Wastewater Information
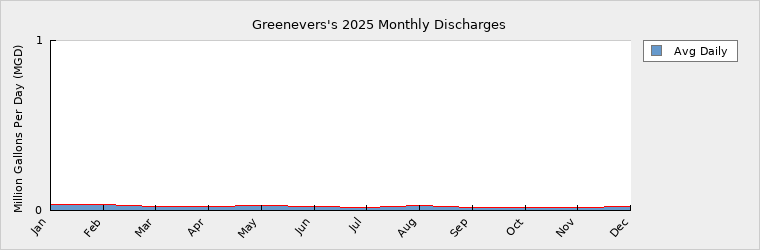
Monthly Discharges
|
Average Daily
Discharge (MGD) |
|
Average Daily
Discharge (MGD) |
|
Average Daily
Discharge (MGD) |
| Jan |
0.0329 |
May |
0.0278 |
Sep |
0.0179 |
| Feb |
0.0324 |
Jun |
0.0208 |
Oct |
0.0162 |
| Mar |
0.0250 |
Jul |
0.0187 |
Nov |
0.0173 |
| Apr |
0.0214 |
Aug |
0.0271 |
Dec |
0.0216 |
Wastewater Permits
| Permit Number |
Type |
Permitted Capacity
(MGD) |
Design Capacity
(MGD) |
Average Annual
Daily Discharge
(MGD) |
Maximum Day Discharge
(MGD) |
Receiving Stream |
Receiving Basin |
| WQ0023910 |
CS |
0.3000 |
0.3600 |
0.0000 |
|
Rock Creek |
Northeast Cape Fear River (02-5) |
Wastewater Interconnections
| Water System |
PWSID |
Type |
Average Daily Amount |
Contract
Maximum (MGD) |
| MGD |
Days Used |
| Town of Wallace |
04-31-010 |
Discharging |
0.0231 |
365 |
0.3600 |
5. Planning
Projections
| |
2025 |
2030 |
2040 |
2050 |
2060 |
2070 |
| Year-Round Population |
1,390 |
1,397 |
1,408 |
1,418 |
1,428 |
1,439 |
| Seasonal Population |
0 |
0 |
0 |
0 |
0 |
0 |
| |
| Residential |
0.0486 |
0.0488 |
0.0491 |
0.0494 |
0.0497 |
0.0500 |
| Commercial |
0.0016 |
0.0016 |
0.0016 |
0.0016 |
0.0016 |
0.0017 |
| Industrial |
0.0000 |
0.0000 |
0.0000 |
0.0000 |
0.0000 |
0.0000 |
| Institutional |
0.0000 |
0.0000 |
0.0000 |
0.0000 |
0.0000 |
0.0000 |
| System Process |
0.0020 |
0.0020 |
0.0020 |
0.0020 |
0.0020 |
0.0020 |
| Unaccounted-for |
0.0351 |
0.0352 |
0.0354 |
0.0356 |
0.0358 |
0.0361 |
Our increase in water demand during 2025 is largely due to lack of controls at our wells and elevated storage tank. We have been operating the system in hand operation for some time now and have experience increased water loss due to tank overflow. We are currently having both wells fully rehabbed and new controls will be put into place, which should significantly reduce our overall water loss in 2026 and in the years ahead.
We fill the above reason(s) are the leading & contributing factor to our increase in %UAW for 2025. Demand v/s Percent of Supply
| |
2025 |
2030 |
2040 |
2050 |
2060 |
2070 |
| Surface Water Supply |
0.0000 |
0.0000 |
0.0000 |
0.0000 |
0.0000 |
0.0000 |
| Ground Water Supply |
0.1000 |
0.1000 |
0.1000 |
0.1000 |
0.1000 |
0.1000 |
| Purchases |
0.0000 |
0.0000 |
0.0000 |
0.0000 |
0.0000 |
0.0000 |
| Future Supplies |
0.0000 |
0.0000 |
0.0000 |
0.0000 |
0.0000 |
| Total Available Supply (MGD) |
0.1000 |
0.1000 |
0.1000 |
0.1000 |
0.1000 |
0.1000 |
| Service Area Demand |
0.0873 |
0.0876 |
0.0881 |
0.0886 |
0.0891 |
0.0898 |
| Sales |
0.0000 |
0.0000 |
0.0000 |
0.0000 |
0.0000 |
0.0000 |
| Future Sales |
0.0000 |
0.0000 |
0.0000 |
0.0000 |
0.0000 |
| Total Demand (MGD) |
0.0873 |
0.0876 |
0.0881 |
0.0886 |
0.0891 |
0.0898 |
| Demand as Percent of Supply |
87% |
88% |
88% |
89% |
89% |
90% |

The purpose of the above chart is to show a general indication of how the long-term per capita water demand changes over time. The per capita water demand may actually be different than indicated due to seasonal populations and the accuracy of data submitted. Water systems that have calculated long-term per capita water demand based on a methodology that produces different results may submit their information in the notes field.
Your long-term water demand is 35 gallons per capita per day. What demand management practices do you plan to implement to reduce the per capita water demand (i.e. conduct regular water audits, implement a plumbing retrofit program, employ practices such as rainwater harvesting or reclaimed water)? If these practices are covered elsewhere in your plan, indicate where the practices are discussed here.
No Changes
Are there other demand management practices you will implement to reduce your future supply needs? No Changes
What supplies other than the ones listed in future supplies are being considered to meet your future supply needs? No Changes
How does the water system intend to implement the demand management and supply planning components above? No Changes
Additional Information
Has this system participated in regional water supply or water use planning? Yes, CCPCUA
What major water supply reports or studies were used for planning? CCPCUA
Please describe any other needs or issues regarding your water supply sources, any water system deficiencies or needed improvements (storage, treatment, etc.) or your ability to meet present and future water needs. Include both quantity and quality considerations, as well as financial, technical, managerial, permitting, and compliance issues: Increase distribution system to service larger customer base and increase water storage capacity.
Our increase in water demand during 2025 is largely due to lack of controls at our wells and elevated storage tank. We have been operating the system in hand operation for some time now and have experience increased water loss due to tank overflow. We are currently having both wells fully rehabbed and new controls will be put into place, which should significantly reduce our overall water loss in 2026 and in the years ahead.
The Division of Water Resources (DWR) provides the data contained within this
Local Water Supply Plan (LWSP) as a courtesy and service to our customers.
DWR staff does not field verify data. Neither DWR, nor any other party
involved in the preparation of this LWSP attests that the data is completely
free of errors and omissions. Furthermore, data users are cautioned that
LWSPs labeled PROVISIONAL have yet to be reviewed by DWR staff. Subsequent
review may result in significant revision. Questions regarding the accuracy
or limitations of usage of this data should be directed to the water system
and/or DWR.
|