|
The Division of Water Resources (DWR) provides the data contained within this
Local Water Supply Plan (LWSP) as a courtesy and service to our customers.
DWR staff does not field verify data. Neither DWR, nor any other party
involved in the preparation of this LWSP attests that the data is completely
free of errors and omissions. Furthermore, data users are cautioned that
LWSPs labeled PROVISIONAL have yet to be reviewed by DWR staff. Subsequent
review may result in significant revision. Questions regarding the accuracy
or limitations of usage of this data should be directed to the water system
and/or DWR.
1. System Information
Contact Information
Complete
| Water System Name: |
Maysville, Town of |
|
PWSID: |
04-52-010 |
| Mailing Address: | P.O. Box 265
Maysville, NC 28555 | Ownership: | Municipality |
| |
| Contact Person: | Schumata Brown | Title: | Town Manager |
| Phone: | 910-734-4441 | Cell/Mobile: | -- |
| |
| Secondary Contact: | John Malone | | Phone: | 336-780-0786 |
| Mailing Address: |
, | Cell/Mobile: | 336-780-0786 |
Distribution System
| Line Type |
Size Range (Inches) |
Estimated % of lines |
| Asbestos Cement |
6-8 |
5.33 % |
| Galvanized Iron |
2 |
0.00 % |
| Polyvinyl Chloride |
2-8 |
94.67 % |
200 ft 2" water line was replaced behind businesses off of 5th St. Programs
New meters will flag a leak on all service lines. For water mains staff visually look for leaks when performing work in the distribution system daily. Water Conservation
The system is connected with Jones County water as a supplemental and emergency source. 2. Water Use Information
Service Area
| Sub-Basin(s) | % of Service Population |
|---|
| White Oak River (17-1) | 100 % |
|
| County(s) | % of Service Population |
|---|
| Jones | 100 % |
|
Population based on 2.45 person per household. PWS persons per house household x 407 residential connections = Population Water Use by Type
| Type of Use |
Metered
Connections |
Metered
Average Use (MGD) |
Non-Metered
Connections |
Non-Metered
Estimated Use (MGD) |
| Residential |
407 |
0.0419 |
0 |
0.0000 |
| Commercial |
44 |
0.0056 |
0 |
0.0000 |
| Industrial |
0 |
0.0000 |
0 |
0.0000 |
| Institutional |
0 |
0.0000 |
1 |
0.0146 |
How much water was used for system processes (backwash, line cleaning, flushing, etc.)? 0.0010 MGD
Institutional connection is an unmetered splash pad. Water Sales
| Purchaser |
PWSID |
Average
Daily Sold
(MGD) |
Days
Used |
Contract |
Required to
comply with water
use restrictions? |
Pipe Size(s)
(Inches) |
Use
Type |
| MGD |
Expiration |
Recurring |
| Jones County Regional Water System |
04-52-020 |
0.0000 |
0 |
0.0000 |
|
Yes |
Yes |
6 |
Emergency |
No Water sold to Jones County in 2025. 3. Water Supply Sources
Monthly Withdrawals & Purchases
|
Average Daily
Use (MGD) |
Max Day
Use (MGD) |
|
Average Daily
Use (MGD) |
Max Day
Use (MGD) |
|
Average Daily
Use (MGD) |
Max Day
Use (MGD) |
| Jan |
0.0727 |
|
May |
0.0752 |
|
Sep |
0.0751 |
0.0735 |
| Feb |
0.0759 |
|
Jun |
0.0735 |
|
Oct |
0.0597 |
0.0760 |
| Mar |
0.0699 |
|
Jul |
0.0789 |
|
Nov |
0.0642 |
0.1190 |
| Apr |
0.0781 |
|
Aug |
0.0812 |
|
Dec |
0.0641 |
0.0695 |
Jan - Sep 18th = Water Purchased from Jones County Water System.
Sep 18th - Dec 31st = Water from Plant / Well Source 
Ground Water Sources
| Name or Number |
Average Daily Withdrawal (MGD) |
Max Day Withdrawal (MGD) |
12-Hour Supply
(MGD) |
CUA Reduction |
Year Offline |
Use Type |
| MGD |
Days Used |
| Well # 1 |
0.0638 |
104 |
0.1190 |
0.1728 |
CUA0 |
|
Regular |
| Well # 2 |
0.0000 |
0 |
|
0.1728 |
CUA0 |
2023 |
Emergency |
Ground Water Sources (continued)
| Name or Number |
Well Depth (Feet) |
Casing Depth
(Feet) |
Screen Depth (Feet) |
Well Diameter (Inches) |
Pump Intake Depth (Feet) |
Metered? |
| Top |
Bottom |
| Well # 1 |
300 |
|
65 |
300 |
8 |
50 |
Yes |
| Well # 2 |
300 |
|
100 |
300 |
8 |
75 |
Yes |
Well 2 is not in service. Water Purchases From Other Systems
| Seller |
PWSID |
Average
Daily Purchased
(MGD) |
Days
Used |
Contract |
Required to
comply with water
use restrictions? |
Pipe Size(s)
(Inches) |
Use
Type |
| MGD |
Expiration |
Recurring |
| Jones County Water System |
04-52-020 |
0.0758 |
261 |
0.0000 |
|
Yes |
Yes |
6 |
Regular |
Jones County Water Purchased Jan 1 - Sept 18th. Source is now for Peaking and Emergency Use. Water Treatment Plants
| Plant Name |
Permitted Capacity
(MGD) |
Is Raw Water Metered? |
Is Finished Water Ouput Metered? |
Source |
| MAYSVILLE WTP |
0.1440 |
Yes |
Yes |
Well #1 (Castle Hayne Aquifer) |
4. Wastewater Information
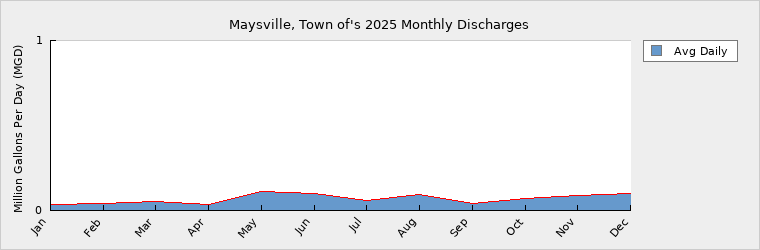
Monthly Discharges
|
Average Daily
Discharge (MGD) |
|
Average Daily
Discharge (MGD) |
|
Average Daily
Discharge (MGD) |
| Jan |
0.0346 |
May |
0.1137 |
Sep |
0.0406 |
| Feb |
0.0434 |
Jun |
0.0997 |
Oct |
0.0732 |
| Mar |
0.0529 |
Jul |
0.0604 |
Nov |
0.0880 |
| Apr |
0.0337 |
Aug |
0.0968 |
Dec |
0.0972 |
Phase 2 of WTP upgrades that double the size aeration basin, upgrade blowers and add tertiary treatment (add disc filter after clarifier) currently underway 2026. Wastewater Permits
| Permit Number |
Type |
Permitted Capacity
(MGD) |
Design Capacity
(MGD) |
Average Annual
Daily Discharge
(MGD) |
Maximum Day Discharge
(MGD) |
Receiving Stream |
Receiving Basin |
| NC0021482 |
WWTP |
0.1800 |
0.1800 |
0.0656 |
0.6600 |
White Oak River |
White Oak River (17-1) |
5. Planning
Projections
| |
2025 |
2030 |
2040 |
2050 |
2060 |
2070 |
| Year-Round Population |
1,034 |
955 |
798 |
667 |
558 |
467 |
| Seasonal Population |
0 |
0 |
0 |
0 |
0 |
0 |
| |
| Residential |
0.0419 |
0.0386 |
0.0322 |
0.0269 |
0.0224 |
0.0187 |
| Commercial |
0.0056 |
0.0052 |
0.0043 |
0.0036 |
0.0030 |
0.0025 |
| Industrial |
0.0000 |
0.0000 |
0.0000 |
0.0000 |
0.0000 |
0.0000 |
| Institutional |
0.0146 |
0.0146 |
0.0146 |
0.0146 |
0.0146 |
0.0146 |
| System Process |
0.0010 |
0.0010 |
0.0015 |
0.0020 |
0.0025 |
0.0030 |
| Unaccounted-for |
0.0093 |
0.0088 |
0.0078 |
0.0069 |
0.0063 |
0.0057 |
Projection is based on a 1.97% negative growth rate per change in population between 2010 & 2020 utilizing census data. Institutional is a splash pad, consumption is expected to remain constant over the projection period (seasonal same hours per day). Demand v/s Percent of Supply
| |
2025 |
2030 |
2040 |
2050 |
2060 |
2070 |
| Surface Water Supply |
0.0000 |
0.0000 |
0.0000 |
0.0000 |
0.0000 |
0.0000 |
| Ground Water Supply |
0.1728 |
0.1728 |
0.1728 |
0.1728 |
0.1728 |
0.1728 |
| Purchases |
0.0758 |
0.0758 |
0.0758 |
0.0758 |
0.0758 |
0.0758 |
| Future Supplies |
0.0000 |
0.0000 |
0.0000 |
0.0000 |
0.0000 |
| Total Available Supply (MGD) |
0.2486 |
0.2486 |
0.2486 |
0.2486 |
0.2486 |
0.2486 |
| Service Area Demand |
0.0724 |
0.0682 |
0.0604 |
0.0540 |
0.0488 |
0.0445 |
| Sales |
0.0000 |
0.0000 |
0.0000 |
0.0000 |
0.0000 |
0.0000 |
| Future Sales |
0.0000 |
0.0000 |
0.0000 |
0.0000 |
0.0000 |
| Total Demand (MGD) |
0.0724 |
0.0682 |
0.0604 |
0.0540 |
0.0488 |
0.0445 |
| Demand as Percent of Supply |
29% |
27% |
24% |
22% |
20% |
18% |

The purpose of the above chart is to show a general indication of how the long-term per capita water demand changes over time. The per capita water demand may actually be different than indicated due to seasonal populations and the accuracy of data submitted. Water systems that have calculated long-term per capita water demand based on a methodology that produces different results may submit their information in the notes field.
Your long-term water demand is 41 gallons per capita per day. What demand management practices do you plan to implement to reduce the per capita water demand (i.e. conduct regular water audits, implement a plumbing retrofit program, employ practices such as rainwater harvesting or reclaimed water)? If these practices are covered elsewhere in your plan, indicate where the practices are discussed here.
No Changes.
Are there other demand management practices you will implement to reduce your future supply needs? None
What supplies other than the ones listed in future supplies are being considered to meet your future supply needs? None
How does the water system intend to implement the demand management and supply planning components above? N/A
Additional Information
Has this system participated in regional water supply or water use planning? No
What major water supply reports or studies were used for planning?
Please describe any other needs or issues regarding your water supply sources, any water system deficiencies or needed improvements (storage, treatment, etc.) or your ability to meet present and future water needs. Include both quantity and quality considerations, as well as financial, technical, managerial, permitting, and compliance issues:
The Division of Water Resources (DWR) provides the data contained within this
Local Water Supply Plan (LWSP) as a courtesy and service to our customers.
DWR staff does not field verify data. Neither DWR, nor any other party
involved in the preparation of this LWSP attests that the data is completely
free of errors and omissions. Furthermore, data users are cautioned that
LWSPs labeled PROVISIONAL have yet to be reviewed by DWR staff. Subsequent
review may result in significant revision. Questions regarding the accuracy
or limitations of usage of this data should be directed to the water system
and/or DWR.
|