|
The Division of Water Resources (DWR) provides the data contained within this
Local Water Supply Plan (LWSP) as a courtesy and service to our customers.
DWR staff does not field verify data. Neither DWR, nor any other party
involved in the preparation of this LWSP attests that the data is completely
free of errors and omissions. Furthermore, data users are cautioned that
LWSPs labeled PROVISIONAL have yet to be reviewed by DWR staff. Subsequent
review may result in significant revision. Questions regarding the accuracy
or limitations of usage of this data should be directed to the water system
and/or DWR.
1. System Information
Contact Information
Complete
| Water System Name: |
Kinston |
|
PWSID: |
04-54-010 |
| Mailing Address: | P.O. Box 339
Kinston, NC 28502 | Ownership: | Municipality |
| |
| Contact Person: | Stephen Miller | Title: | Public Services Director |
| Phone: | 252-939-3303 | Cell/Mobile: | -- |
| |
| Secondary Contact: | Joey pittman | | Phone: | 252-939-3286 |
| Mailing Address: | P.O. Box 339
Kinston, NC 28502 | Cell/Mobile: | -- |
Distribution System
| Line Type |
Size Range (Inches) |
Estimated % of lines |
| Asbestos Cement |
6-16 |
10.00 % |
| Cast Iron |
6-18 |
15.70 % |
| Ductile Iron |
6-18 |
35.30 % |
| Galvanized Iron |
1-3 |
9.50 % |
| Polyvinyl Chloride |
2-16 |
29.50 % |
Programs
Water Conservation
Interconnection with North Lenoir Water Corporation 2. Water Use Information
Service Area
| Sub-Basin(s) | % of Service Population |
|---|
| Neuse River (10-1) | 100 % |
|
| County(s) | % of Service Population |
|---|
| Lenoir | 100 % |
|
Water Use by Type
| Type of Use |
Metered
Connections |
Metered
Average Use (MGD) |
Non-Metered
Connections |
Non-Metered
Estimated Use (MGD) |
| Residential |
11,310 |
1.8000 |
0 |
0.0000 |
| Commercial |
0 |
0.0000 |
0 |
0.0000 |
| Industrial |
28 |
2.0200 |
0 |
0.0000 |
| Institutional |
0 |
0.0000 |
0 |
0.0000 |
How much water was used for system processes (backwash, line cleaning, flushing, etc.)? 0.3705 MGD
Water Sales
| Purchaser |
PWSID |
Average
Daily Sold
(MGD) |
Days
Used |
Contract |
Required to
comply with water
use restrictions? |
Pipe Size(s)
(Inches) |
Use
Type |
| MGD |
Expiration |
Recurring |
| Deep Run Water Corporation |
04-54-030 |
0.0000 |
0 |
0.0000 |
9999 |
Yes |
No |
12 |
Regular |
| North Lenoir Water Corporation |
04-54-025 |
0.0000 |
0 |
0.0000 |
2099 |
Yes |
Yes |
8 |
Emergency |
3. Water Supply Sources
Monthly Withdrawals & Purchases
|
Average Daily
Use (MGD) |
Max Day
Use (MGD) |
|
Average Daily
Use (MGD) |
Max Day
Use (MGD) |
|
Average Daily
Use (MGD) |
Max Day
Use (MGD) |
| Jan |
4.6209 |
7.4455 |
May |
4.4985 |
5.9618 |
Sep |
4.6897 |
6.2163 |
| Feb |
4.5154 |
5.8291 |
Jun |
4.7345 |
6.2180 |
Oct |
4.6737 |
6.0082 |
| Mar |
4.8184 |
6.7555 |
Jul |
4.7289 |
6.2197 |
Nov |
4.2765 |
5.4238 |
| Apr |
4.5973 |
6.4655 |
Aug |
4.7697 |
6.4141 |
Dec |
4.3874 |
5.4104 |

Ground Water Sources
| Name or Number |
Average Daily Withdrawal (MGD) |
Max Day Withdrawal (MGD) |
12-Hour Supply
(MGD) |
CUA Reduction |
Year Offline |
Use Type |
| MGD |
Days Used |
| 1 |
0.1588 |
87 |
0.4390 |
0.1650 |
CUA25 |
|
Regular |
| 1,3 |
0.0000 |
0 |
0.4390 |
0.1650 |
CUA0 |
|
Regular |
| 10 |
0.0000 |
0 |
0 |
0.0000 |
CUA25 |
|
Emergency |
| 11 |
0.5427 |
206 |
2.3210 |
0.7200 |
CUA25 |
|
Regular |
| 12 |
0.4842 |
81 |
0.0580 |
0.7416 |
CUA25 |
|
Regular |
| 13 |
0.3140 |
99 |
0.7660 |
0.3240 |
CUA25 |
|
Regular |
| 14 |
0.2318 |
134 |
0.6450 |
0.4680 |
CUA25 |
|
Regular |
| 16 |
0.1701 |
65 |
0.4790 |
0.5490 |
CUA25 |
|
Regular |
| 18 |
0.1022 |
46 |
0.3730 |
0.4680 |
CUA25 |
|
Regular |
| 20 |
0.0297 |
90 |
0.0600 |
0.0396 |
CUA25 |
|
Regular |
| 21 |
0.3639 |
142 |
0.9470 |
0.3384 |
CUA25 |
|
Regular |
| 23 |
0.0000 |
0 |
0 |
0.0000 |
CUA25 |
|
Regular |
| 24 |
0.0000 |
0 |
0 |
0.0000 |
CUA25 |
|
Regular |
| 3 |
0.1926 |
83 |
0.4920 |
0.1440 |
CUA25 |
|
Regular |
| 4 |
0.3062 |
148 |
0.9790 |
0.4680 |
CUA25 |
|
Regular |
| 5 |
0.2993 |
104 |
0.7720 |
0.2880 |
CUA25 |
|
Regular |
| 6 |
0.3962 |
139 |
0.9880 |
0.3240 |
CUA25 |
|
Regular |
| 7 |
0.2298 |
121 |
0.6730 |
0.2736 |
CUA25 |
|
Regular |
| 8 |
0.3863 |
123 |
0.8140 |
0.6120 |
CUA25 |
|
Regular |
| 9 |
0.2994 |
148 |
1.0250 |
0.4960 |
CUA25 |
|
Regular |
| NRWASA-Kinston |
0.0000 |
0 |
0 |
0.0000 |
CUA0 |
|
Regular |
Ground Water Sources (continued)
| Name or Number |
Well Depth (Feet) |
Casing Depth
(Feet) |
Screen Depth (Feet) |
Well Diameter (Inches) |
Pump Intake Depth (Feet) |
Metered? |
| Top |
Bottom |
| 1 |
360 |
|
205 |
356 |
12 |
247 |
Yes |
| 1,3 |
|
|
|
|
|
|
Yes |
| 10 |
415 |
|
250 |
412 |
10 |
274 |
No |
| 11 |
420 |
|
302 |
370 |
10 |
234 |
Yes |
| 12 |
490 |
|
270 |
485 |
10 |
237 |
Yes |
| 13 |
395 |
|
302 |
395 |
8 |
195 |
Yes |
| 14 |
405 |
|
240 |
388 |
12 |
200 |
Yes |
| 16 |
325 |
|
271 |
325 |
6 |
210 |
Yes |
| 18 |
330 |
|
270 |
320 |
12 |
138 |
Yes |
| 20 |
312 |
|
183 |
270 |
6 |
168 |
Yes |
| 21 |
439 |
|
379 |
429 |
14 |
320 |
Yes |
| 23 |
453 |
|
300 |
375 |
14 |
0 |
Yes |
| 24 |
509 |
|
282 |
388 |
14 |
0 |
Yes |
| 3 |
365 |
|
315 |
365 |
8 |
273 |
Yes |
| 4 |
520 |
|
390 |
515 |
10 |
230 |
Yes |
| 5 |
443 |
|
230 |
433 |
10 |
220 |
Yes |
| 6 |
483 |
|
230 |
447 |
10 |
190 |
Yes |
| 7 |
445 |
|
215 |
440 |
10 |
236 |
Yes |
| 8 |
527 |
|
316 |
482 |
10 |
197 |
Yes |
| 9 |
482 |
|
272 |
482 |
10 |
245 |
Yes |
| NRWASA-Kinston |
|
|
|
|
|
|
Yes |
Water Purchases From Other Systems
| Seller |
PWSID |
Average
Daily Purchased
(MGD) |
Days
Used |
Contract |
Required to
comply with water
use restrictions? |
Pipe Size(s)
(Inches) |
Use
Type |
| MGD |
Expiration |
Recurring |
| North Lenoir Water Corporation |
04-54-025 |
0.0000 |
0 |
0.0000 |
2099 |
Yes |
No |
8 |
Emergency |
| NRWASA |
60-54-001 |
3.0663 |
365 |
3.0705 |
2048 |
Yes |
Yes |
36 |
Regular |
4. Wastewater Information
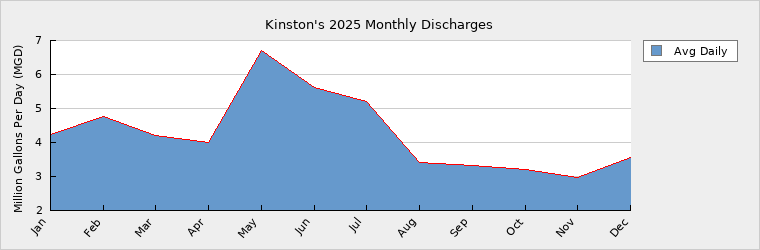
Monthly Discharges
|
Average Daily
Discharge (MGD) |
|
Average Daily
Discharge (MGD) |
|
Average Daily
Discharge (MGD) |
| Jan |
4.2400 |
May |
6.7140 |
Sep |
3.3290 |
| Feb |
4.7790 |
Jun |
5.6250 |
Oct |
3.1940 |
| Mar |
4.2110 |
Jul |
5.2150 |
Nov |
2.9770 |
| Apr |
3.9900 |
Aug |
3.4080 |
Dec |
3.5540 |
Wastewater Permits
| Permit Number |
Type |
Permitted Capacity
(MGD) |
Design Capacity
(MGD) |
Average Annual
Daily Discharge
(MGD) |
Maximum Day Discharge
(MGD) |
Receiving Stream |
Receiving Basin |
| NC0024236 |
WWTP |
11.8500 |
11.8500 |
4.2690 |
17.9000 |
neuse river |
Neuse River (10-1) |
Wastewater Interconnections
| Water System |
PWSID |
Type |
Average Daily Amount |
Contract
Maximum (MGD) |
| MGD |
Days Used |
| Greene County Regional Water |
04-40-106 |
Receiving |
0.0076 |
365 |
0.3000 |
| Town of Cove City |
04-25-045 |
Receiving |
0.0264 |
365 |
0.1000 |
| Town of Dover |
04-25-025 |
Receiving |
0.0489 |
365 |
0.1000 |
5. Planning
Projections
| |
2025 |
2030 |
2040 |
2050 |
2060 |
2070 |
| Year-Round Population |
28,275 |
28,400 |
29,000 |
29,500 |
30,000 |
30,500 |
| Seasonal Population |
0 |
0 |
0 |
0 |
0 |
0 |
| |
| Residential |
1.8000 |
1.8100 |
1.8500 |
1.8900 |
1.9100 |
1.9400 |
| Commercial |
0.0000 |
0.0000 |
0.0000 |
0.0000 |
0.0000 |
0.0000 |
| Industrial |
2.0200 |
2.0500 |
2.1500 |
2.3500 |
2.5000 |
2.6000 |
| Institutional |
0.0000 |
0.0000 |
0.0000 |
0.0000 |
0.0000 |
0.0000 |
| System Process |
0.3705 |
0.3710 |
0.3710 |
0.3710 |
0.3710 |
0.3710 |
| Unaccounted-for |
0.4216 |
0.4500 |
0.4500 |
0.4500 |
0.4500 |
0.4500 |
Future Supply Sources
| Source Name |
PWSID |
Source Type |
Additional Supply |
Year Online |
Year Offline |
Type |
| City of Kinston Banked Water |
04-54-010 |
Ground |
1.1000 |
2026 |
2039 |
Regular |
| City of Kinston Banked Water |
04-54-010 |
Ground |
1.3000 |
2040 |
2049 |
Regular |
| City of Kinston Banked Water |
04-54-010 |
Ground |
1.6000 |
2050 |
2055 |
Regular |
The demand/supply (D/S) percentage for 2025 is 96%, exceeding the 80% ratio considered by DEQ to be the minimum needed for adequate planning purposes. However, as of April 2026, Kinston has 15,113,258,600 gallons of banked under the CCPCUA program which can be counted towards its total available supply. This Banked Water, shown under 'Future Supplies', has been applied to reduce the D/S ratios to less than 80% from 2026 through 2050. Demand v/s Percent of Supply
| |
2025 |
2030 |
2040 |
2050 |
2060 |
2070 |
| Surface Water Supply |
0.0000 |
0.0000 |
0.0000 |
0.0000 |
0.0000 |
0.0000 |
| Ground Water Supply |
1.7432 |
1.7432 |
1.7432 |
1.7432 |
1.7432 |
1.7432 |
| Purchases |
3.0705 |
3.0705 |
3.0705 |
3.0705 |
3.0705 |
3.0705 |
| Future Supplies |
1.1000 |
1.3000 |
1.6000 |
0.0000 |
0.0000 |
| Total Available Supply (MGD) |
4.8137 |
5.9137 |
6.1137 |
6.4137 |
4.8137 |
4.8137 |
| Service Area Demand |
4.6121 |
4.6810 |
4.8210 |
5.0610 |
5.2310 |
5.3610 |
| Sales |
0.0000 |
0.0000 |
0.0000 |
0.0000 |
0.0000 |
0.0000 |
| Future Sales |
0.0000 |
0.0000 |
0.0000 |
0.0000 |
0.0000 |
| Total Demand (MGD) |
4.6121 |
4.6810 |
4.8210 |
5.0610 |
5.2310 |
5.3610 |
| Demand as Percent of Supply |
96% |
79% |
79% |
79% |
109% |
111% |

The purpose of the above chart is to show a general indication of how the long-term per capita water demand changes over time. The per capita water demand may actually be different than indicated due to seasonal populations and the accuracy of data submitted. Water systems that have calculated long-term per capita water demand based on a methodology that produces different results may submit their information in the notes field.
Your long-term water demand is 64 gallons per capita per day. What demand management practices do you plan to implement to reduce the per capita water demand (i.e. conduct regular water audits, implement a plumbing retrofit program, employ practices such as rainwater harvesting or reclaimed water)? If these practices are covered elsewhere in your plan, indicate where the practices are discussed here.
No changes - this is a reduction of 11 gallons per day from last year
Are there other demand management practices you will implement to reduce your future supply needs? Continuation of retrofit rebate program and public education, combined with encouraging customers to set up access to our portal which will provide them with daily water use information provide them with their Green Score to measure their efficiency.
What supplies other than the ones listed in future supplies are being considered to meet your future supply needs? Kinston has an option to purchase additional supply from the Neuse Regional Water and Sewer Authority (NRWASA). Their surface plant is currently only using 50% of its design capacity.
How does the water system intend to implement the demand management and supply planning components above? No capital investment is required to implement the components. It will involve adjustments to operations by existing staff.
Additional Information
Has this system participated in regional water supply or water use planning? Yes, Kinston is a member of the Neuse Regional Water and Sewer Authority has received water from NRWASA since 2008.
What major water supply reports or studies were used for planning? 1995 City of Kinston Water Supply Master Plan
2000 Lenoir County Water System Master Plan
Please describe any other needs or issues regarding your water supply sources, any water system deficiencies or needed improvements (storage, treatment, etc.) or your ability to meet present and future water needs. Include both quantity and quality considerations, as well as financial, technical, managerial, permitting, and compliance issues: Kinston is facing two immediate challenges related to water quality. One is the EPA PFAS regulations. These rules, which still seem to change every year, will result in additional treatment procedures and costs at NRWASA and possibly at some wells. The Neuse River, which is NRWASA's water source is contaminated and NRWASA will be implementing plant changes. If these changes cannot be completed in time for compliance, Kinston may have to revert to well water until they are complete. Kinston is also facing huge costs to meet Lead Service LIne Replacement regulations, despite not finding any lead pipes in our system. Kinston may be required to invest as much as $20 million to replace GRR lines over the next 12 years. This would divert funds that could otherwise be used to replace aging pipes across our system.
The Division of Water Resources (DWR) provides the data contained within this
Local Water Supply Plan (LWSP) as a courtesy and service to our customers.
DWR staff does not field verify data. Neither DWR, nor any other party
involved in the preparation of this LWSP attests that the data is completely
free of errors and omissions. Furthermore, data users are cautioned that
LWSPs labeled PROVISIONAL have yet to be reviewed by DWR staff. Subsequent
review may result in significant revision. Questions regarding the accuracy
or limitations of usage of this data should be directed to the water system
and/or DWR.
|