|
The Division of Water Resources (DWR) provides the data contained within this
Local Water Supply Plan (LWSP) as a courtesy and service to our customers.
DWR staff does not field verify data. Neither DWR, nor any other party
involved in the preparation of this LWSP attests that the data is completely
free of errors and omissions. Furthermore, data users are cautioned that
LWSPs labeled PROVISIONAL have yet to be reviewed by DWR staff. Subsequent
review may result in significant revision. Questions regarding the accuracy
or limitations of usage of this data should be directed to the water system
and/or DWR.
1. System Information
Contact Information
Complete
| Water System Name: |
Grifton |
|
PWSID: |
04-74-035 |
| Mailing Address: | 528 Queen Street, P.O. Box 579
Grifton, NC 28530 | Ownership: | Municipality |
| |
| Contact Person: | Dylan Haman | Title: | Town Manager |
| Phone: | 252-524-0109 | Cell/Mobile: | -- |
| |
| Secondary Contact: | Mike Houston | | Phone: | 919-812-6088 |
| Mailing Address: |
, NC 28525 | Cell/Mobile: | -- |
Distribution System
| Line Type |
Size Range (Inches) |
Estimated % of lines |
| Asbestos Cement |
12 |
4.00 % |
| Cast Iron |
6-8 |
31.00 % |
| Ductile Iron |
12 |
1.00 % |
| Galvanized Iron |
2 |
32.00 % |
| Polyvinyl Chloride |
6-12 |
32.00 % |
During the 2025 calendar year, the Town added approximately 2,430 linear feet of new 8" pvc watermain. Programs
As employees ride throughout the system they are looking for leaks. We also utilize NCRWA as needed. Water Conservation
2. Water Use Information
Service Area
| Sub-Basin(s) | % of Service Population |
|---|
| Contentnea Creek (10-2) | 100 % |
|
| County(s) | % of Service Population |
|---|
| Pitt | 90 % |
| Lenoir | 10 % |
|
After further review, I believe our old population number may be inaccurate. It looks like our current population according to the State Demographer is 2,589. This is lagged by 1 year. We have had 151 new residential connections since that time. At 2.2 residents per connection, our current population would have increased to an estimated 2,921.
I believe the previous number was in error. Water Use by Type
| Type of Use |
Metered
Connections |
Metered
Average Use (MGD) |
Non-Metered
Connections |
Non-Metered
Estimated Use (MGD) |
| Residential |
1,328 |
0.1086 |
0 |
0.0000 |
| Commercial |
53 |
0.0063 |
0 |
0.0000 |
| Industrial |
0 |
0.0000 |
0 |
0.0000 |
| Institutional |
2 |
0.0021 |
0 |
0.0000 |
How much water was used for system processes (backwash, line cleaning, flushing, etc.)? 0.0028 MGD
Water Sales
| Purchaser |
PWSID |
Average
Daily Sold
(MGD) |
Days
Used |
Contract |
Required to
comply with water
use restrictions? |
Pipe Size(s)
(Inches) |
Use
Type |
| MGD |
Expiration |
Recurring |
| Ayden |
04-74-025 |
0.0000 |
0 |
0.0000 |
|
Yes |
Yes |
12 |
Emergency |
3. Water Supply Sources
Monthly Withdrawals & Purchases
|
Average Daily
Use (MGD) |
Max Day
Use (MGD) |
|
Average Daily
Use (MGD) |
Max Day
Use (MGD) |
|
Average Daily
Use (MGD) |
Max Day
Use (MGD) |
| Jan |
0.1650 |
|
May |
0.1613 |
|
Sep |
0.1598 |
|
| Feb |
0.1486 |
|
Jun |
0.1666 |
|
Oct |
0.1468 |
|
| Mar |
0.1711 |
|
Jul |
0.1622 |
|
Nov |
0.1529 |
|
| Apr |
0.1586 |
|
Aug |
0.1523 |
|
Dec |
0.1692 |
|

Ground Water Sources
| Name or Number |
Average Daily Withdrawal (MGD) |
Max Day Withdrawal (MGD) |
12-Hour Supply
(MGD) |
CUA Reduction |
Year Offline |
Use Type |
| MGD |
Days Used |
| 3 |
0.0000 |
0 |
|
0.4320 |
CUA25 |
|
Regular |
Ground Water Sources (continued)
| Name or Number |
Well Depth (Feet) |
Casing Depth
(Feet) |
Screen Depth (Feet) |
Well Diameter (Inches) |
Pump Intake Depth (Feet) |
Metered? |
| Top |
Bottom |
| 3 |
483 |
|
360 |
473 |
12 |
306 |
Yes |
Water Purchases From Other Systems
| Seller |
PWSID |
Average
Daily Purchased
(MGD) |
Days
Used |
Contract |
Required to
comply with water
use restrictions? |
Pipe Size(s)
(Inches) |
Use
Type |
| MGD |
Expiration |
Recurring |
| Ayden |
04-74-025 |
0.0000 |
0 |
|
|
Yes |
Yes |
12 |
Emergency |
| Neuse Regional Water and Sewer Authority |
60-54-001 |
0.1600 |
365 |
0.1440 |
2048 |
Yes |
Yes |
12 |
Regular |
4. Wastewater Information
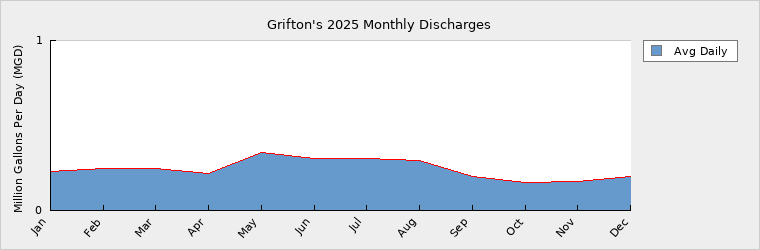
Monthly Discharges
|
Average Daily
Discharge (MGD) |
|
Average Daily
Discharge (MGD) |
|
Average Daily
Discharge (MGD) |
| Jan |
0.2312 |
May |
0.3416 |
Sep |
0.2023 |
| Feb |
0.2445 |
Jun |
0.3086 |
Oct |
0.1656 |
| Mar |
0.2486 |
Jul |
0.3049 |
Nov |
0.1733 |
| Apr |
0.2174 |
Aug |
0.2965 |
Dec |
0.2025 |
Wastewater Interconnections
| Water System |
PWSID |
Type |
Average Daily Amount |
Contract
Maximum (MGD) |
| MGD |
Days Used |
| Contentnea Metropolitan Sewer Dist. |
00-00-000 |
Discharging |
0.2450 |
365 |
|
5. Planning
Projections
| |
2025 |
2030 |
2040 |
2050 |
2060 |
2070 |
| Year-Round Population |
2,921 |
3,962 |
5,028 |
5,749 |
6,573 |
7,515 |
| Seasonal Population |
0 |
0 |
0 |
0 |
0 |
0 |
| |
| Residential |
0.1086 |
0.1442 |
0.1894 |
0.2165 |
0.2475 |
0.2829 |
| Commercial |
0.0063 |
0.0084 |
0.0093 |
0.0106 |
0.0121 |
0.0138 |
| Industrial |
0.0000 |
0.0000 |
0.0000 |
0.0000 |
0.0000 |
0.0000 |
| Institutional |
0.0021 |
0.0028 |
0.0032 |
0.0036 |
0.0041 |
0.0046 |
| System Process |
0.0028 |
0.0032 |
0.0036 |
0.0040 |
0.0044 |
0.0048 |
| Unaccounted-for |
0.0402 |
0.0532 |
0.0690 |
0.0788 |
0.0900 |
0.1027 |
2030 was determined using a projected growth rate of 4.85% due to a huge population increase expected over the next 5-7 years.
Each following year(s) were based of off a growth rate of 1.50%.
Regarding Future supply -- a note from Grifton indicates that the Town of is actually in the process of having a Mothballed well rehabilitated.They are actually almost finished with the project and are just waiting on DEQ approval to re-add the well as “active” on our permit. The well is designed for 0.36 MGD. They have also had conversations with NRWASA; currently, WASA has available capacity and can meet the needs by itself if necessary.
Based on the Grifton response, an additional future purchased supply of 0.2000 MGD from NCWASA is shown here to bring demand to supply ratios to below 80% by 2050. Future Supply Sources
| Source Name |
PWSID |
Source Type |
Additional Supply |
Year Online |
Year Offline |
Type |
| NRWASA |
60-54-001 |
Purchase |
0.2000 |
2026 |
|
Regular |
Regarding Future supply -- a note from Grifton indicates that the Town of is actually in the process of having a Mothballed well rehabilitated.They are actually almost finished with the project and are just waiting on DEQ approval to re-add the well as “active” on our permit. The well is designed for 0.36 MGD. They have also had conversations with NRWASA; currently, WASA has available capacity and can meet the needs by itself if necessary.
Based on the Grifton response, an additional future purchased supply of 0.2000 MGD from NCWASA is shown here to bring demand to supply ratios to below 80% by 2050. Demand v/s Percent of Supply
| |
2025 |
2030 |
2040 |
2050 |
2060 |
2070 |
| Surface Water Supply |
0.0000 |
0.0000 |
0.0000 |
0.0000 |
0.0000 |
0.0000 |
| Ground Water Supply |
0.1000 |
0.1000 |
0.1000 |
0.1000 |
0.1000 |
0.1000 |
| Purchases |
0.1440 |
0.1600 |
0.1600 |
0.1600 |
0.1600 |
0.1600 |
| Future Supplies |
0.2000 |
0.2000 |
0.2000 |
0.2000 |
0.2000 |
| Total Available Supply (MGD) |
0.2440 |
0.4600 |
0.4600 |
0.4600 |
0.4600 |
0.4600 |
| Service Area Demand |
0.1600 |
0.2118 |
0.2745 |
0.3135 |
0.3581 |
0.4088 |
| Sales |
0.0000 |
0.0000 |
0.0000 |
0.0000 |
0.0000 |
0.0000 |
| Future Sales |
0.0000 |
0.0000 |
0.0000 |
0.0000 |
0.0000 |
| Total Demand (MGD) |
0.1600 |
0.2118 |
0.2745 |
0.3135 |
0.3581 |
0.4088 |
| Demand as Percent of Supply |
66% |
46% |
60% |
68% |
78% |
89% |

The purpose of the above chart is to show a general indication of how the long-term per capita water demand changes over time. The per capita water demand may actually be different than indicated due to seasonal populations and the accuracy of data submitted. Water systems that have calculated long-term per capita water demand based on a methodology that produces different results may submit their information in the notes field.
Your long-term water demand is 37 gallons per capita per day. What demand management practices do you plan to implement to reduce the per capita water demand (i.e. conduct regular water audits, implement a plumbing retrofit program, employ practices such as rainwater harvesting or reclaimed water)? If these practices are covered elsewhere in your plan, indicate where the practices are discussed here.
No Changes
Are there other demand management practices you will implement to reduce your future supply needs? No Changes
What supplies other than the ones listed in future supplies are being considered to meet your future supply needs? The Town of Grifton is actually in the process of having a well rehabilitated. We are actually almost finished with the project and are just waiting on DEQ approval to re-add the well as “active” on our permit. The well is designed for 0.36 MGD. We have also had conversations with NRWASA; currently, WASA has available capacity and can meet our needs by itself if necessary.
How does the water system intend to implement the demand management and supply planning components above? No Changes
Additional Information
Has this system participated in regional water supply or water use planning? Yes, CCPCUA
What major water supply reports or studies were used for planning? CCPCUA
Please describe any other needs or issues regarding your water supply sources, any water system deficiencies or needed improvements (storage, treatment, etc.) or your ability to meet present and future water needs. Include both quantity and quality considerations, as well as financial, technical, managerial, permitting, and compliance issues: Additional elevated storage tank, booster station to aid with low pressure areas within the distribution system, more inner connections for added redundancy, replacement of galvanized water mains, and the replacement of approximately 300 galvanized steel service lines.
The Division of Water Resources (DWR) provides the data contained within this
Local Water Supply Plan (LWSP) as a courtesy and service to our customers.
DWR staff does not field verify data. Neither DWR, nor any other party
involved in the preparation of this LWSP attests that the data is completely
free of errors and omissions. Furthermore, data users are cautioned that
LWSPs labeled PROVISIONAL have yet to be reviewed by DWR staff. Subsequent
review may result in significant revision. Questions regarding the accuracy
or limitations of usage of this data should be directed to the water system
and/or DWR.
|